. 2019 Jul 11;8:e44288. doi: 10.7554/eLife.44288

Figure 2. Genome-wide CRISPRi screens identify factors that resensitize lung cancer cells to inhibition of CDK9 or MCL1.

(A) Schematic outlining the genome-wide CRISPRi screen in LK2 cells. Cells were exposed to acute drug treatments, fixed and FACS-sorted using the fluorogenic apoptotic detection reagent Cell Event. Enriched and depleted sgRNAs were identified by next-generation sequencing. (B + C) Volcano plots showing sgRNA-targeted genes significantly enriched or depleted in the apoptosing cell population following treatment with CDK9i (B) or MCL1i (C). Average of two independent experiments is graphed. Green highlighted points indicate genes with a known role in apoptosis that had a significant fold change over background. Magenta points highlight members of the CUL5-RNF7-UBE2F ubiquitin complex that were significantly enriched. Beige highlighted points are members of the Eukaryotic Translation Initiation Factor 3 (eIF3) complex. Blue point on CDK9i volcano plot highlights EIF4G2, a gene that may be involved in cap-independent translation of Bcl-xL.

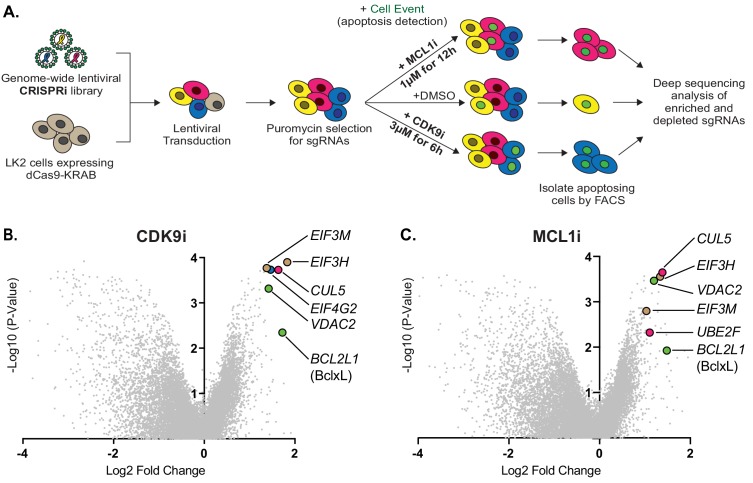
Figure 2—source data 1. ScreenProcessing: sgRNA counts.
DOI: 10.7554/eLife.44288.007
Figure 2—source data 2. ScreenProcessing: sgRNA phenotype scores.
DOI: 10.7554/eLife.44288.008
Figure 2—source data 3. ScreenProcessing: gene phenotype scores.
DOI: 10.7554/eLife.44288.009
Figure 2—source data 4. MAGeCK: sgRNA summary for CDK9i.
DOI: 10.7554/eLife.44288.010
Figure 2—source data 5. MAGeCK: gene summary for CDK9i.
CDK9i treatment condition compared to ‘background’. Ordered by top enriched genes.
DOI: 10.7554/eLife.44288.011
Figure 2—source data 6. MAGeCK: sgRNA summary for MCL1i.
DOI: 10.7554/eLife.44288.012
Figure 2—source data 7. MAGeCK: gene summary for MCL1i.
MCL1i treatment condition compared to background. Ordered by top enriched genes.
DOI: 10.7554/eLife.44288.013

Figure 2.

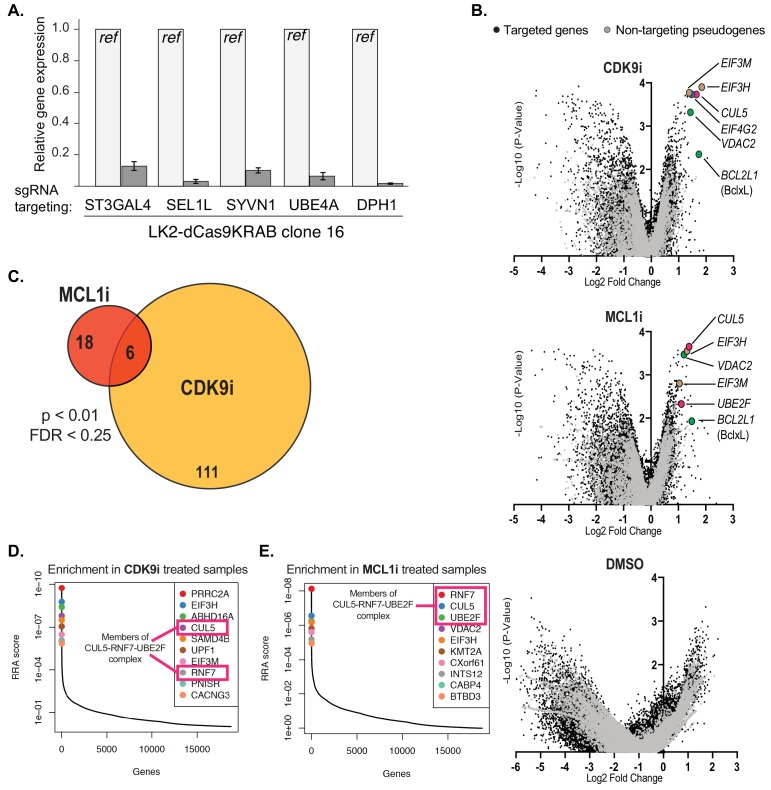
Figure 2—figure supplement 1. Performing the genome-wide CRISPRi screens and analysis of results.

Figure 2—figure supplement 1.

(A) Bar graph showing knockdown of five genes by qRT-PCR to confirm functionality of the dCas9-KRAB CRISPRi construct in an isolated clone of LK2 cells. (B) Volcano plots (as in Figure 2B) showing significantly enriched and depleted genes when treated with CDK9i (top), MCL1 (middle) and DMSO (bottom). Black dots indicate targeted genes. Gray dots indicate negative control pseudogenes with non-targeting guides. Highlighted points of different colors show genes with significant fold changes with annotated roles in apoptosis (green), factors of the CUL5-RNF7-UBE2F ubiquitin complex (magenta), and members of the eIF3 complex (beige). (C) Venn diagram of overlapping hits between CDK9i and MCL1i screens as determined by MAGeCK analysis using a threshold of p<0.01 and FDR < 0.25. Number of hits listed in circles. (D + E) Relative sgRNA enrichment was also determined by the MAGeCK analysis pipeline. Top 10 targeted genes following CDK9i and MCL1i treatment are shown in (D) and (E), respectively. sgRNAs targeting members of the CUL5-RNF7-UBE2F complex (outlined in magenta box) were once again identified as enriched and were amongst the most significant hits.