. 2019 Aug 9;8:e48318. doi: 10.7554/eLife.48318

Figure 1. Screening of a DUB-RNAi library identifies that USP 18/41/49 regulates the expression of A3G.

(A) Domain organization of five DUB subfamilies. (B) HEK293T cells were seeded into a 96-well plate with 20,000 cells/well, and then transfected with plasmids expressing A3G-GFP and Vif-HA, as well as siRNAs specific for USP18, USP41, or USP49 respectively. The GFP expression was detected with a PE Envision at 48 hr post-transfection. Error bars represent the SEM of three independent experiments.* p<0.05. (C) HEK293T cells were transfected with plasmids expressing A3G-HA and Vif-HA, as well as siRNAs specific for USP18, USP41, or USP49 respectively. After 48 hr, cells were lysed and Western blot was performed with the indicated antibodies. Representative data were shown and plotted with at least three independent experiments.* p<0.05. (D) HEK293T cells were transfected with plasmids expressing A3G-HA, Vif-HA, and one of plasmid expressing USP18-Flag, USP41-Flag, USP49-Flag. After 48 hr, cells were lysed and Western blot was performed with the indicated antibodies. Representative data were shown and plotted with at least three independent experiments.* p<0.05, **p<0.01. (E) HEK293T cells were transfected with indicated amounts of plasmids expressing A3G-GFP, Vif-HA, or USP49-Flag. The GFP expression was detected with a PE Envision at 48 hr post-transfection. Error bars represent the SEM of three independent experiments.

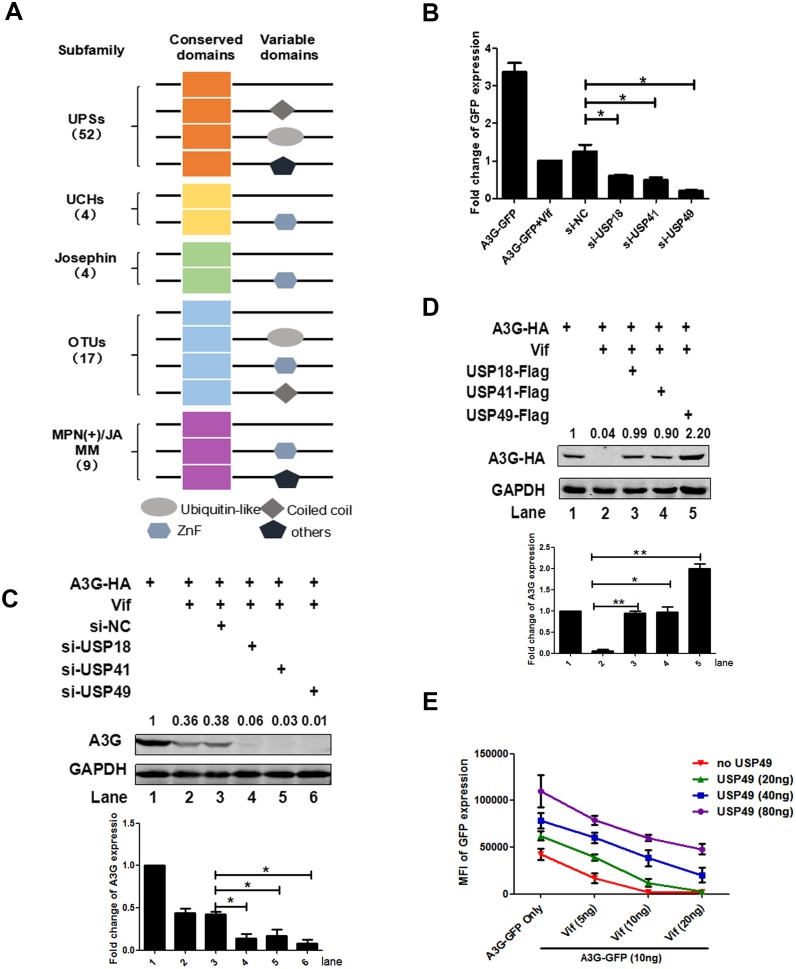
Figure 1.

Figure 1—figure supplement 1. The schematic of high-throughput screening.

Figure 1—figure supplement 1.

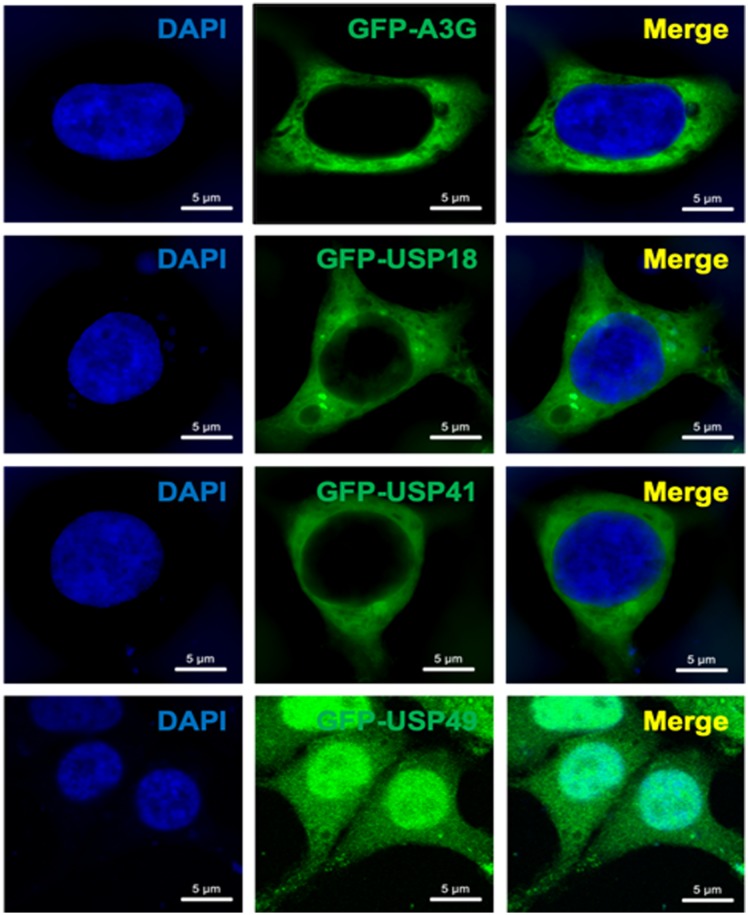
Figure 1—figure supplement 2. The distribution of GFP-tagged DUBs and A3G protein.

Figure 1—figure supplement 2.

HEK293T cells were transfected with plasmids expressing USP18-GFP, USP41-GFP, USP49-GFP, and A3G-GFP respectively. After 48 hr, the cells were fixed with 4% paraformaldehyde, and the distribution of DUBs and A3G was detected using a Confocal Microscope.
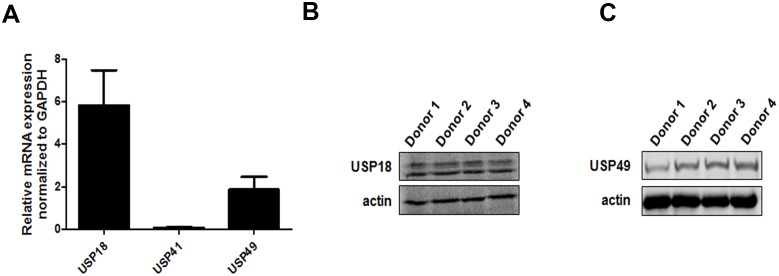
Figure 1—figure supplement 3. The expression of endogenous DUBs in primary CD4+ T cells.

Figure 1—figure supplement 3.

(A) Primary CD4+ T cells were isolated from four healthy donors. The mRNA levels of these DUBs were detected by qPCR with their specific primers. Error bars represent the SEM of three independent experiments. (B) The protein level of USP18 in primary CD4+ T cells was detected by western blotting with indicated antibodies. (C) The protein level of USP49 in primary CD4+ T cells was detected by western blotting with indicated antibodies.
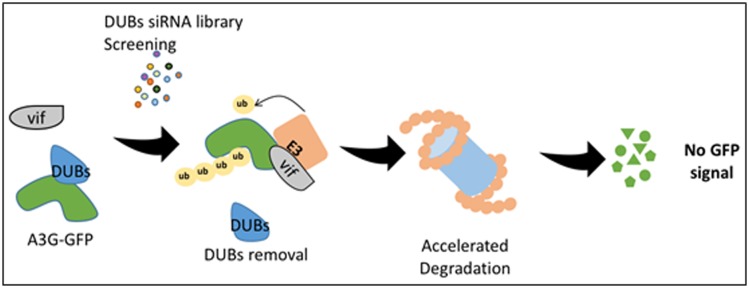
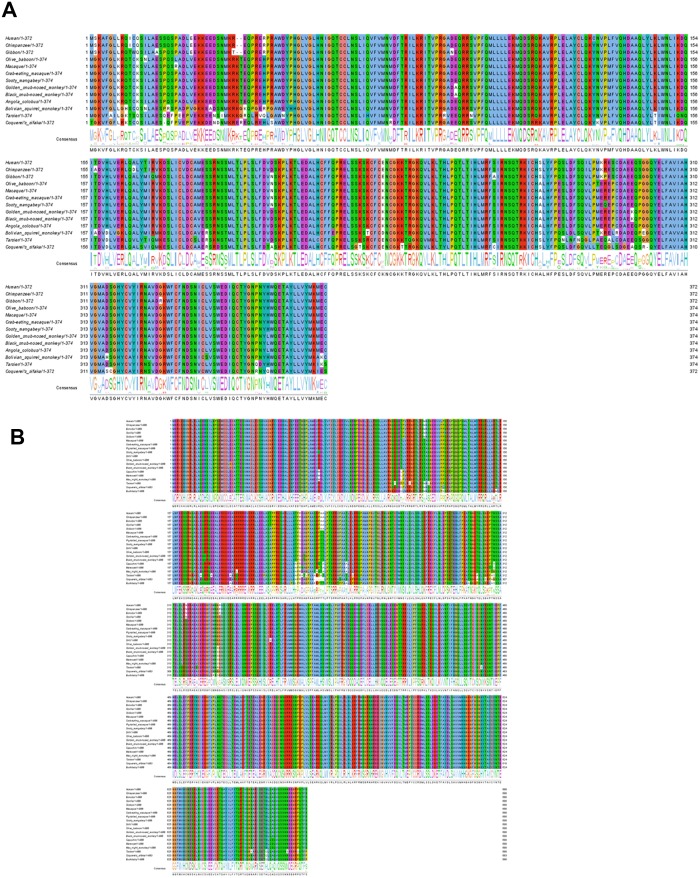
Figure 1—figure supplement 4. The conservativeness analysis of DUBs among anthropoids.

Figure 1—figure supplement 4.

Primate protein sequences were retrieved from the Ensemble database (http://www.ensembl.org). Orthologues of USP18 (A) and USP49 (B) in other species were confirmed with the comparative genomics from the Ensemble and UCSC Genome databases. Multiple protein sequences alignment was created using the MUSCLE algorithm. Further visualization and conservation analysis with the consensus sequence logos of the multiple sequence alignment were conducted using the Jalview program. The amino acids were colored according to their chemicophysical properties, and the length was shown in the sequence name. Dashes ('-') represent gaps in the sequence.