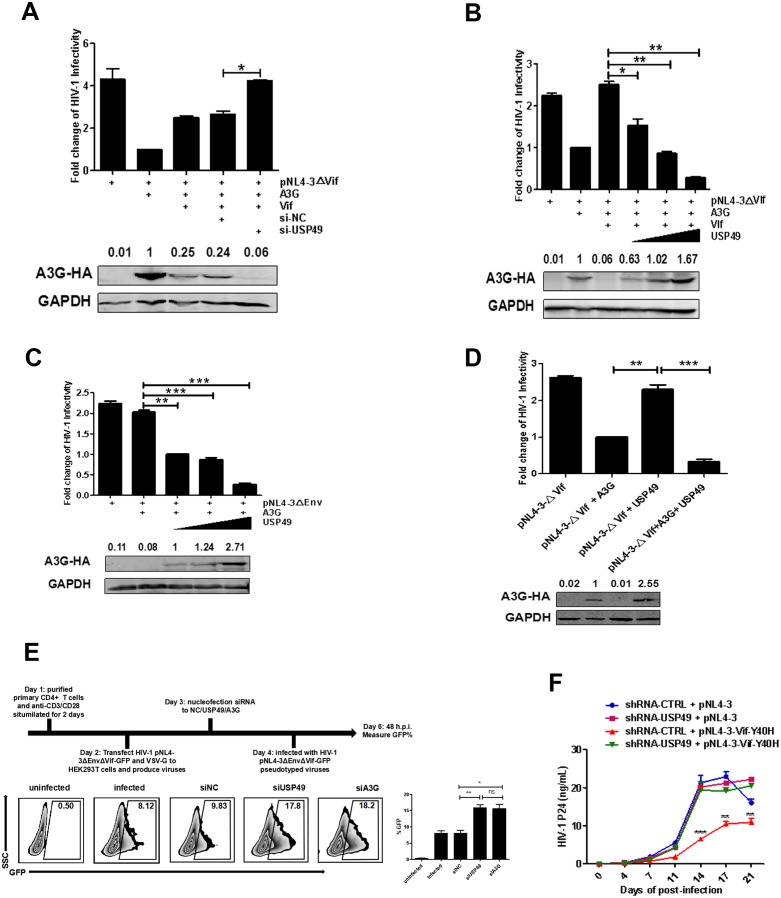
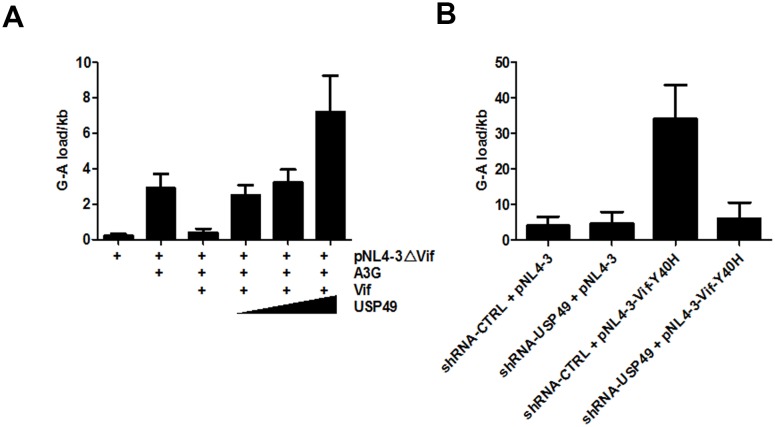
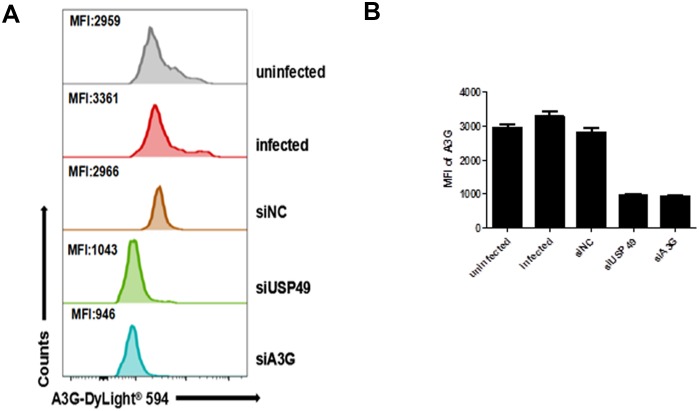
Figure 2. USP49 enhances the inhibitory effect of A3G on the infectivity of HIV-1.
(A) HEK293T cells were first transfected with USP49-specific siRNA. After 12 hr, cells were co-transfected with pcDNA3.1-A3G-HA, pcDNA3.1-Vif-HA, and pNL4-3ΔVif. Culture supernatants were harvested at 72 hr post-transfection and then infected TZM-bl cells. After 48 hr, cells were harvested and the HIV-1 infectivity was detected by luciferase assay. Error bars represent the SEM of three independent experiments. *p<0.05. (B) HEK293T cells were co-transfected with pcDNA3.1-A3G-HA, pNL4-3ΔVif, and plasmids expressing Vif-HA or USP49-Flag respectively. Culture supernatants were harvested at 72 hr post-transfection and then allowed to infect TZM-bl cells. After 48 hr, cells were harvested and the HIV-1 infectivity was detected by luciferase assay. Error bars represent the SEM of three independent experiments. *p<0.05, **p<0.01. (C) HEK293T cells were co-transfected with pcDNA3.1-A3G-HA, pNL4-3ΔEnv, and different amounts of USP49-Flag-expressing plasmid respectively. Culture supernatants were harvested at 72 hr post-transfection and then infected TZM-bl cells. After 48 hr, cells were harvested and the HIV-1 infectivity was detected by luciferase assay. Error bars represent the SEM of three independent experiments. **p<0.01, ***p<0.001. (D) HEK293T cells were transfected with pNL4-3ΔVif, pcDNA3.1-A3G-HA plus pNL4-3ΔVif, or pNL4-3ΔVif plus USP49-Flag plasmids respectively. Culture supernatants were harvested at 72 hr post-transfection and then allowed to infect TZM-bl cells. After 48 hr, cells were harvested and the HIV-1 infectivity was detected by luciferase assay. Error bars represent the SEM of three independent experiments. ***p<0.001. (E) The primary CD4+T cells were stimulated with anti-CD3/28 for 2 days and then nucleofected with indicated siRNAs. After 24 hr, cells were infected with pNL4-3ΔEnvΔVif-GFP pseudotyped viruses. The infectivity were detected by flow cytometr on 48 h.p.i. Representative data were shown and plotted with at least three independent experiments.* p<0.05, **p<0.01. (F) HEK293T cells were transfected with pNL4-3 or Vif-Y40H-mutated-pNL4-3 respectively. Culture supernatants were harvested at 72 hr post-transfection and then allowed to infect shRNA-KD-USP49 primary CD4+ T cells. Cell supernatants were harvested for detecting HIV-1 P24 by ELISA Kit on several time points. Error bars represent the SEM of three independent experiments. The difference of p24 production from HIV-1NL4-3VifY40H infection between shRNA-NC and shRNA-KD-USP49 in primary CD4+ T cells at several time points was statistically analyzed. **p<0.01, ***p<0.001.


