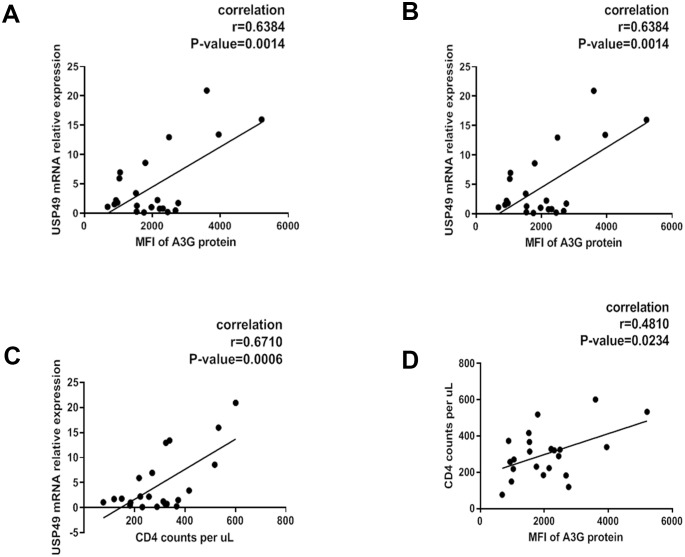
Figure 5. Associations of plasma HIV-1 RNA levels, CD4+ T cell counts and USP49 mRNA expression levels in the newly-diagnosed HIV-1-infected individuals.
(A) Correlation between the expression of A3G protein level and the USP49 mRNA level in the CD4+T cells isolated from the newly-diagnosed HIV-1-infected individuals (n = 21). Pearson correlation coefficient and p value are listed. (B) Correlation between the count of CD4+T cells and the USP49 mRNA level in the CD4+T cells isolated from the newly-diagnosed HIV-1-infected individuals. Pearson correlation coefficient and p value are listed. (C) Correlation between the count of CD4+T cells and the A3G protein level in the CD4+T cells isolated from the newly-diagnosed HIV-1-infected individuals. Pearson correlation coefficient and p value are listed. (D) Correlation between the plasma HIV-1 RNA levels and the USP49 mRNA level in the CD4+T cells isolated from the newly-diagnosed HIV-1-infected individuals. Pearson correlation coefficient and p value are listed.


