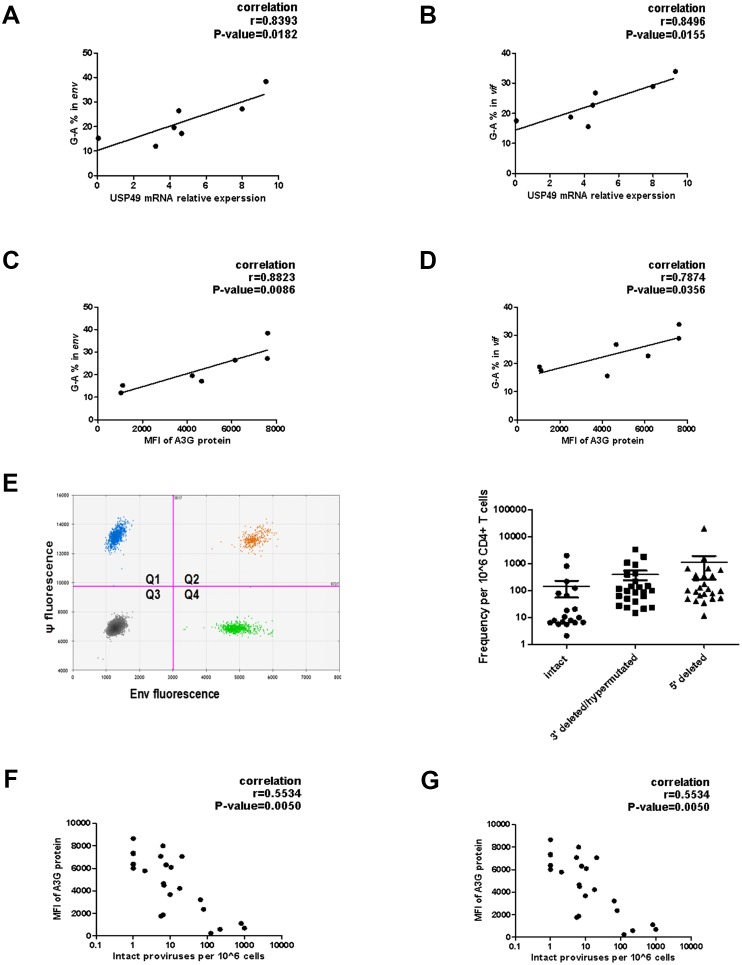
Figure 6. Associations of defective proviruses and USP49 mRNA expression levels in the CD4+ T cells isolated from HIV-1-infected individuals receiving suppressive cART.
(A–B) The percentage of G-to-A in env and vif population sequences correlates with USP49 mRNA expression level in the CD4+ T cells from HIV-1-infected individuals (n = 7). Pearson correlation coefficient and p value are listed. (C–D) The percentage of G-to-A in env and vif population sequences correlates with A3G protein level in the CD4+ T cells from HIV-1-infected individuals (n = 7). Pearson correlation coefficient and p value are listed. (E) Representative IPDA results from a patient’s CD4+ T cell sample. Boxed areas are expanded to show individual positive droplets (Left). IDPA results on CD4+ T cells from HIV-1-infected individuals (n = 24) with plasma HIV-1 RNA below the limit of detection (right). (F) Correlation between the intact proviruses and the A3G protein level in the CD4+T cells isolated from the indicated clinical HIV-1 patients. Pearson correlation coefficient and p value are listed. (G) Correlation between the intact proviruses and the USP49 mRNA level in the CD4+T cells isolated from the indicated clinical HIV-1 patients. Pearson correlation coefficient and p value are listed.

