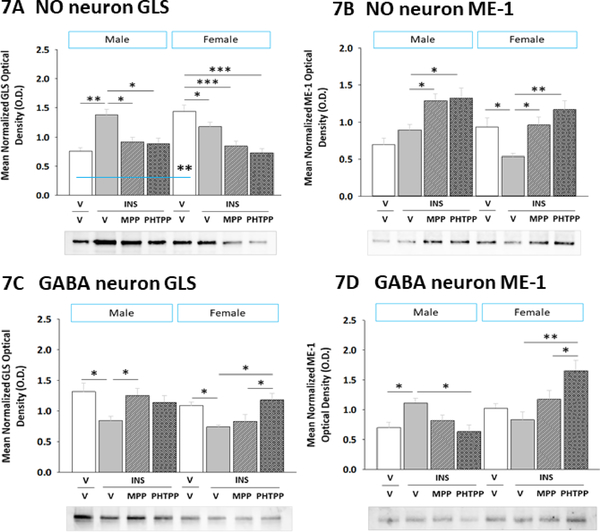
Figure 7. Effects of MPP or PHTPP Pretreatment on VMN Nitrergic and GABAergic Neuron Glutaminase (GLS) and Malic Enzyme-1 (ME-1) Protein Expression in Hypoglycemic Male versus Female Rats.
Pooled lysates of nNOS- or GAD-ir neurons were created for each treatment group for Western blot analysis of GLS and ME-1. Data depict nitrergic nerve cell GLS [Panel A] and ME-1 [Panel B] and GABAergic neuron GLS [Panel C] and ME-1 [Panel D] profiles in groups of male (at left) and female (at right) rats treated by V/V (n=6 males, n=6 females), V/INS (10.0 U/kg bw, sc; n=6 males, n=6 females), MPP/INS (n=6 males, n=6 females), or PHTPP/INS (n=6 males, n=6 females). Bars indicate mean normalized protein O.D. measures ± S.E.M. Data were analyzed by two-way ANOVA for sex versus treatment. *p<0.05; **p<0.01; ***p<0.001.

