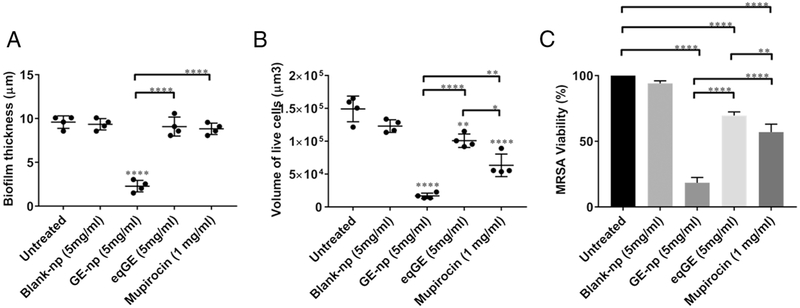
Figure 6.
Quantitative analysis of biofilm architecture (A) Biofilm thickness and (B) Biofilm volume. The thickness and volume of viable cells in the biofilms exposed to GE-np, blank-np, equivalent garlic extract (eqGE) or mupirocin were observed in the z-stack construction of the confocal images and was quantified using Volocity software v6.3. The differences were examined and compared with that of the untreated biofilms (media alone). The results represented as mean ± SD, were from multiple images of two independent confocal experiments. Statistical significance (*p ≤ 0.05, **p < 0.01, ****p < 0.0001) was determined by one-way ANOVA. (C) Biofilm viability. The percentage viability of biofilm-associated cells was evaluated using XTT assay. The results are represented as mean ± SD from three independent experiments performed in triplicates. Statistical significance (**p < 0.01, ****p < 0.0001) was determined by one-way ANOVA.

