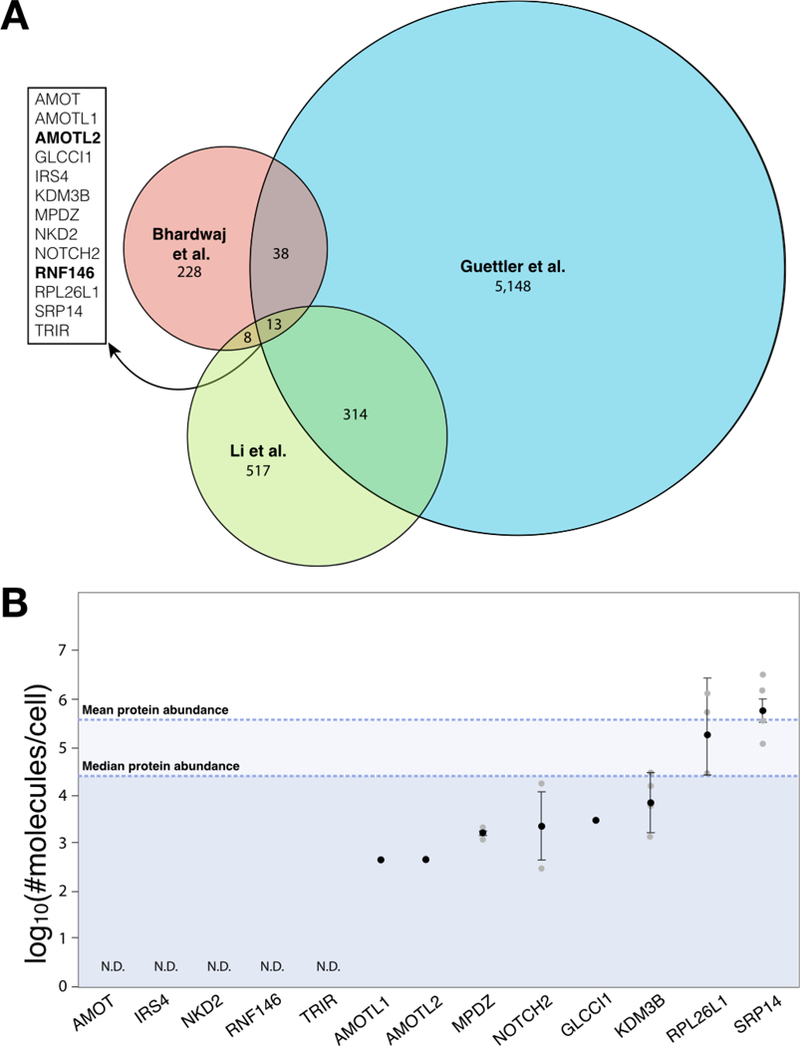
Figure 5. Comparison of three PARP5a/b interactome studies.

A. Venn diagram displaying the overlap of protein identifications among an in silico study identifying proteins with at least one Tankyrase- binding motif (5,513 proteins; Guettler), global analyses of proteins that increase in abundance upon PARP5a/b knockout (287 proteins; Bhardwaj), and proteomics analyses of PARP5a/b interactors (852 proteins; Li). For the Guettler study, only proteins with IUPred disorder score ≥ 0.45 are included for the analyses, which increases the stringency of the in silico prediction based on ref. [26]. Proteins identified in all three studies are listed on the left, with established PARdU substrates in bold. B. As in Figure 4, protein levels measured in log10(#molecules/cell) from four human cell line studies are plotted as mean±standard error (in black) overlaid over individual data points (grey). The mean and median protein abundance across all studies are noted. N.D., not detected by mass spectrometry across all studies.
