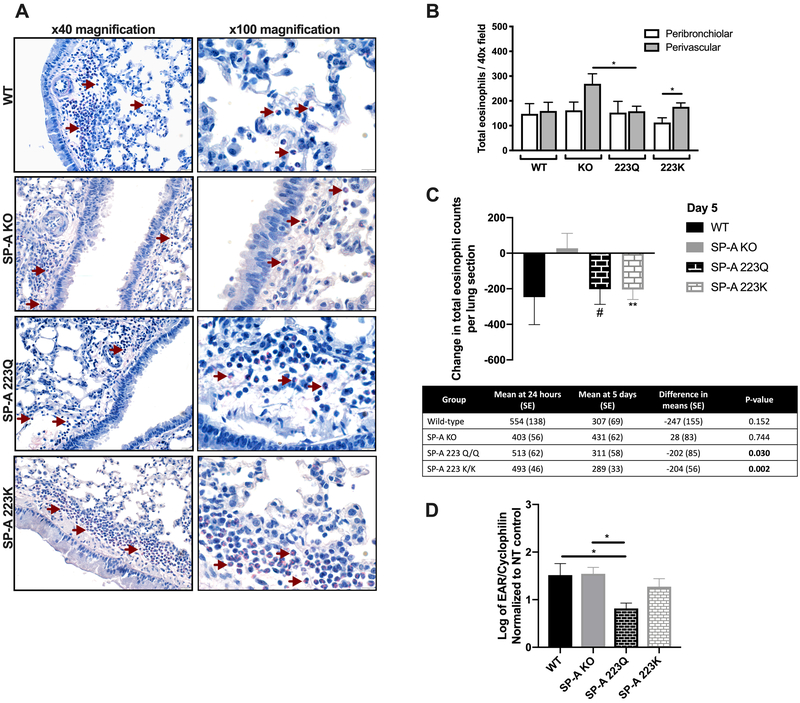
Figure 2. Assessment of tissue eosinophilia over time.
A) Representative bright field images of eosinophils (red arrows indicate representative eosinophils with bright pink-stained cytoplasm) in lung tissue by Sirius red staining (left panel: 40x magnification, right panel: 100x magnification) and B) quantification of eosinophil counts at day 5. C) Net change in eosinophil frequencies over time. Table shows difference in means at 24 hours and 5 days, unpaired Student’s t-test, #p<0.05, **p<0.01 D) EAR mRNA in lung tissue at 5 days post-terminal challenge. One-way ANOVA with Bonferonni’s correction for multiple comparisons, *p<0.05. Data (mean ± SEM) are from at least two independent experiments with n = 3-5 mice/group.

