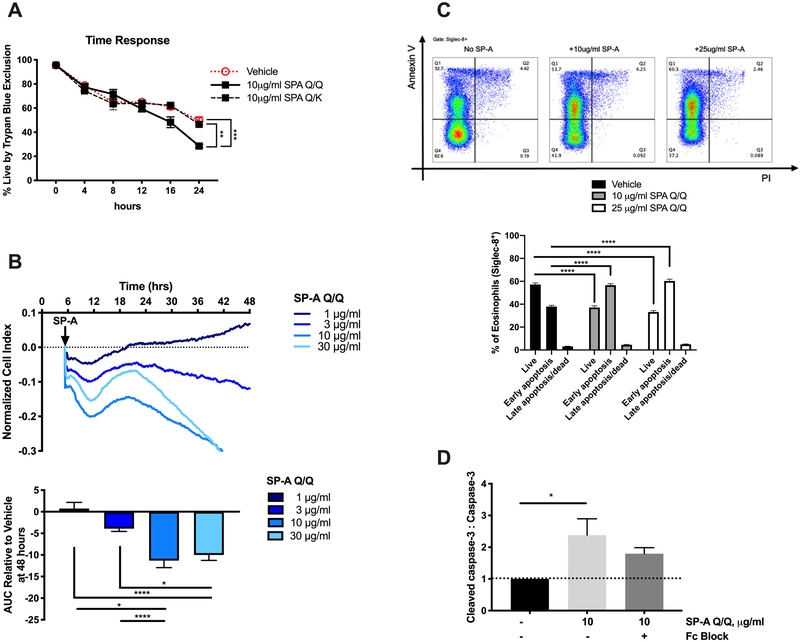
Figure 5. Evaluation of the ability of SP-A to induce eosinophil apoptosis in mouse and human eosinophils in vitro.
A) Time course of viability assessed by Trypan Blue and B) RTCA tracing and dose response of in vitro stimulation of mouse eosinophils by SP-A, AUC = area under the curve. C) Representative flow diagrams of human eosinophil apoptosis and cell death by Annexin V and PI and quantification after 16 hours incubation with SP-A; live = Annexin V−, PI−, early apoptosis = Annexin V+, PI−, late apoptosis/dead = Annexin V+, PI+ D) Densitometry of caspase-3 by Western blot of mouse eosinophils standardized to non-treated control. ANOVA with correction for multiple comparisons, *p<0.05, **p<0.01, ***p<0.001, ****p<0.0001. Data (mean ± SEM) are from at least two independent experiments with n = 2-3 replicates/treatment.

