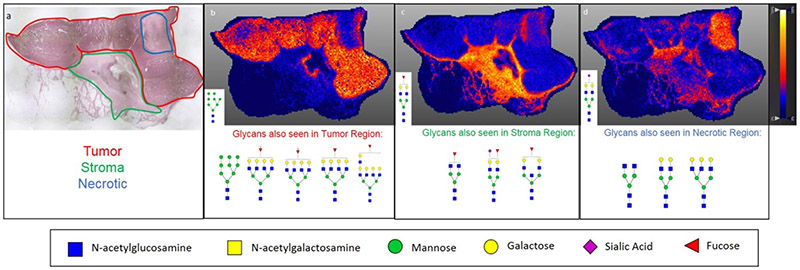
Figure 5:
Linking Histopathology with MALDI IMS Glycan Images. a) H&E stain of an invasive ductal carcinoma at 2X magnification with pathologist annotation of tumor (red), stroma (green), and necrotic (blue) regions. b) Distribution of Hex8HexNAc2 + 1Na (m/z 1743.5956) showing strong correlation with the tumor region of the tissue. c) Distribution of Hex5dHex1HexNAc2 + 1Na (m/z 1809.6838) throughout stroma region of the tissue. d) Distribution of Hex5HexNAc4NeuAc1 + 1Na throughout necrotic and stromal region of the tissue. Additionally, other glycan structures seen correlating with each region in b-d are shown below the respective image. Images were created using SCiLS Lab 2017a and previously described in Scott et. al. 2018.

