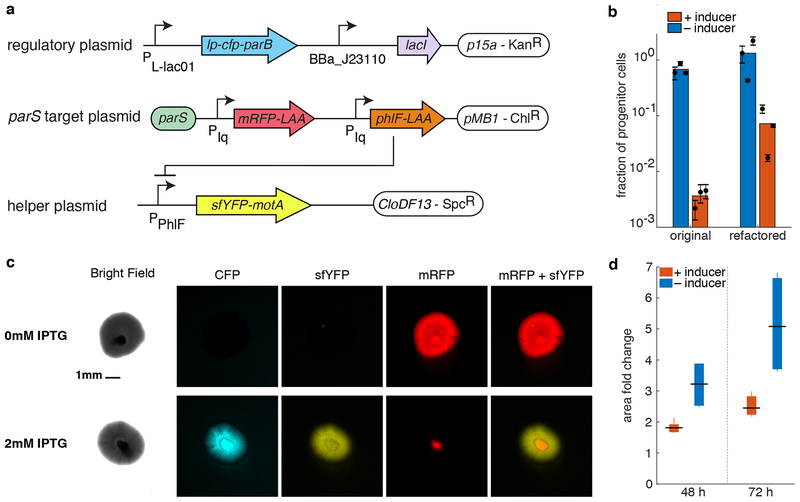
Figure 4.
Physical separation of genetically different cells. (a) APP circuits refactored to be functional in HCB84 E. coli strain. It consists of three plasmids, out of which only one is the target plasmid and will, therefore, asymmetrically partition. (b) The graph shows the efficiency of the refactored circuit in E. coli HCB84 compared to the original system in JS006 ALT as measured by plating assay. Colored bars represent the average of all trials, black dots represent the average of each biological replicate and their error bars the standard deviation of technical triplicates. (c) Pictures of colonies growing in semi-solid agarose plates (0.3%) with (bottom panel) and without (upper panel) inducer. Columns show different fluorescence channels of the same image. Scale bar is shown only at time on the bright field picture of the uninduced condition and is the same for every image. (d) Area fold change of colonies grown on agarose with and without inducer. The area of each colony at time 48 and 72 h was normalized to the area of the same colony 24 h after the inoculation. Data shown as standard box plot.

