Figure 5.
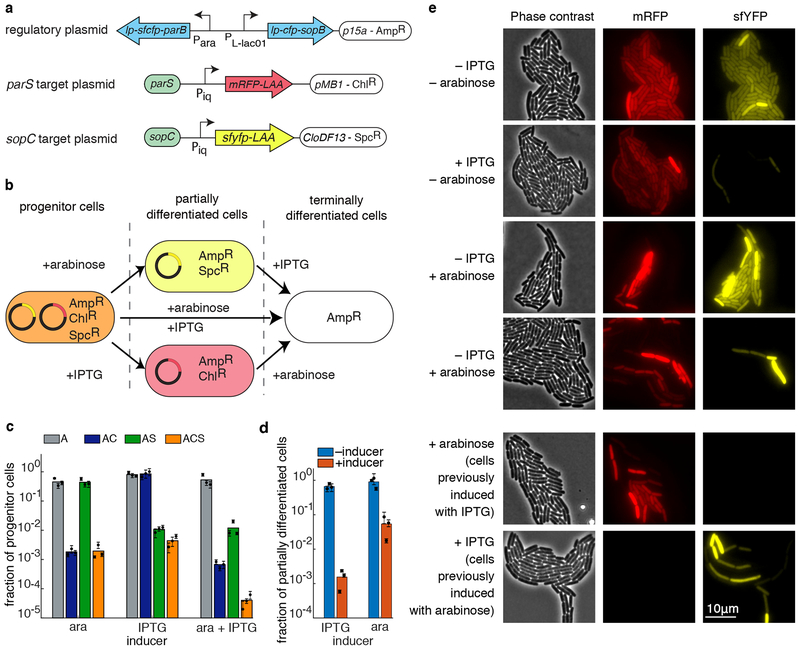
An orthogonal APP system. (a) Schematics of key elements on each of the three plasmids used to test orthogonal partitioning. (b) Diagram of possible differentiation routes for the progenitor cells. Depending on the inducers, progenitor cells can lose either one of the target plasmids, or both. (c) Fraction of progenitor cells in different antibiotic conditions for different combinations of the inducers, as measured by the plating assay (A – ampicillin; C – chloramphenicol; S – spectinomycin). When induced with just arabinose, chloramphenicol resistance is lost. When induced with just IPTG, spectinomycin resistance is lost. When induced with both arabinose and IPTG, both spectinomycin and chloramphenicol resistances are lost. (d) Fraction of partially differentiated cells (as measured by the plating assay) with (red) and without (blue) induction of the remaining APP system. In both cases, the remaining APP system retains its ability to differentiate. Colored bars represent the average of all trials, black dots represent the average of each biological replicate and their error bars the standard deviation of technical triplicates (c,d). (e) Phase contrast (left), red fluorescence (middle), and yellow fluorescence (right) images of cells after induction with various combinations of inducers. Also shown (bottom two rows) are colonies previously induced for differentiation of one pathway undergoing induction for the other pathway.

