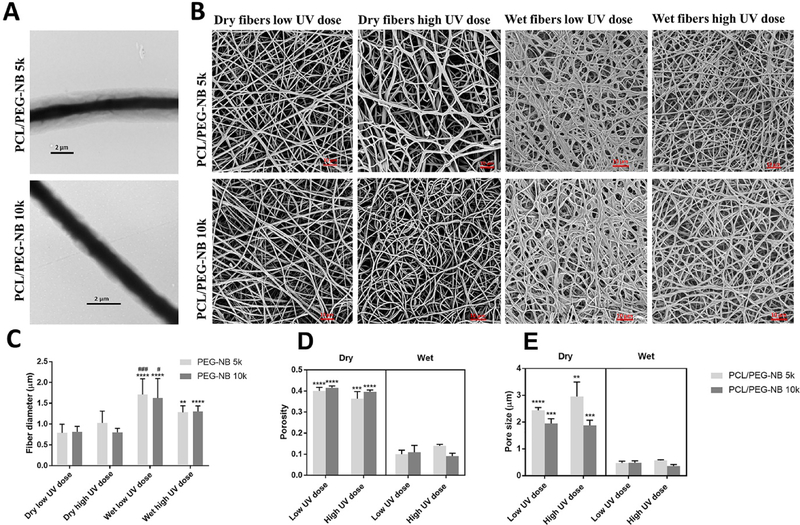
Fig. 1.
Representative electron microscopy images and quantitative analyses of coaxially-structured fibers. (A) TEM images of as-spun coaxial fibers. (B) SEM images of coaxial fiber scaffolds, which were polymerized at different UV doses and stored in either dry or hydrated conditions. (C) Fiber diameter before and after hydration of coaxial blends. ‘*’ comparing vs. dry, ‘#’ comparing vs. wet high UV dose. (D) Porosity and (E) Pore size of coaxial blends before and after hydration. ‘*’ comparing vs. dry PCL/PEG-NB. The coaxial microfibers include: PCL/PEG-NB 5k and PCL/PEG-NB 10k. (A): scale bar = 2 μm.

