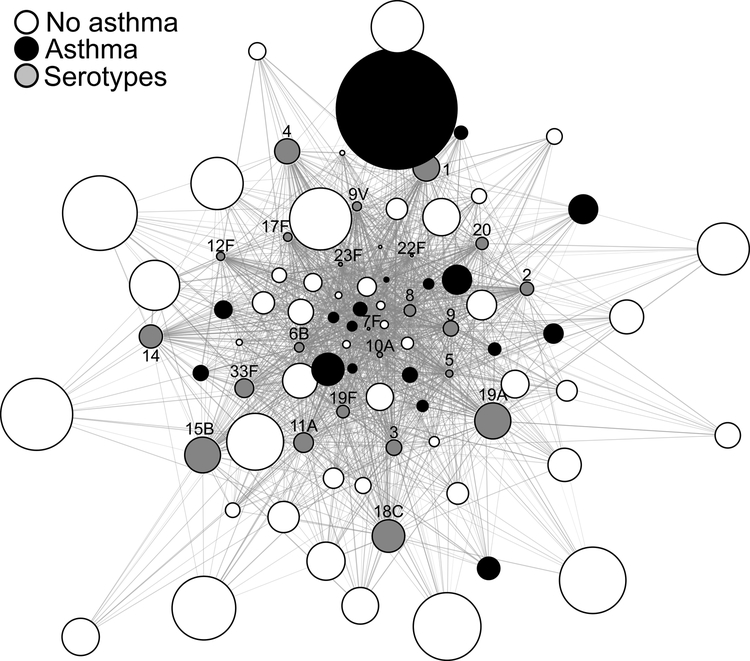
Figure 1.
Network graph depicting simultaneously the relationships between basal titers of all 23 serotypes (grey nodes) for all subjects, the vaccine response as fold change (node sizes) for summative patterns of pneumococcal antibody responses in control subjects (white) to those with asthma (black).

