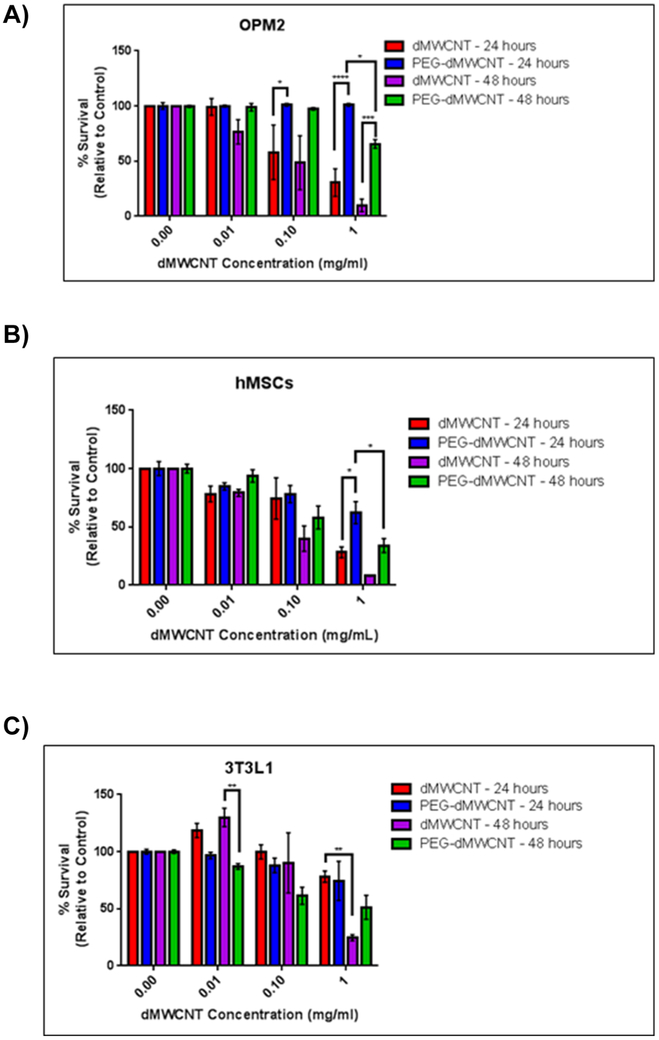
Figure 2: Cytotoxicity Profiles of dMWCNTs vs PEG-dMWCNTs.
Cytotoxicity assay comparing multiple cell types over a 24 and 48-hour treatment period with various doses of dMWCNTs and PEG-dMWCNTs (A) OPM2, (B) hMSCs, (C) 3T3L1 cells. Statistics were done using 2-way ANOVA with Sidak’s multiple comparisons test at 24 and 48 hours for each cell line, n=4-6.

