Fig. 3.
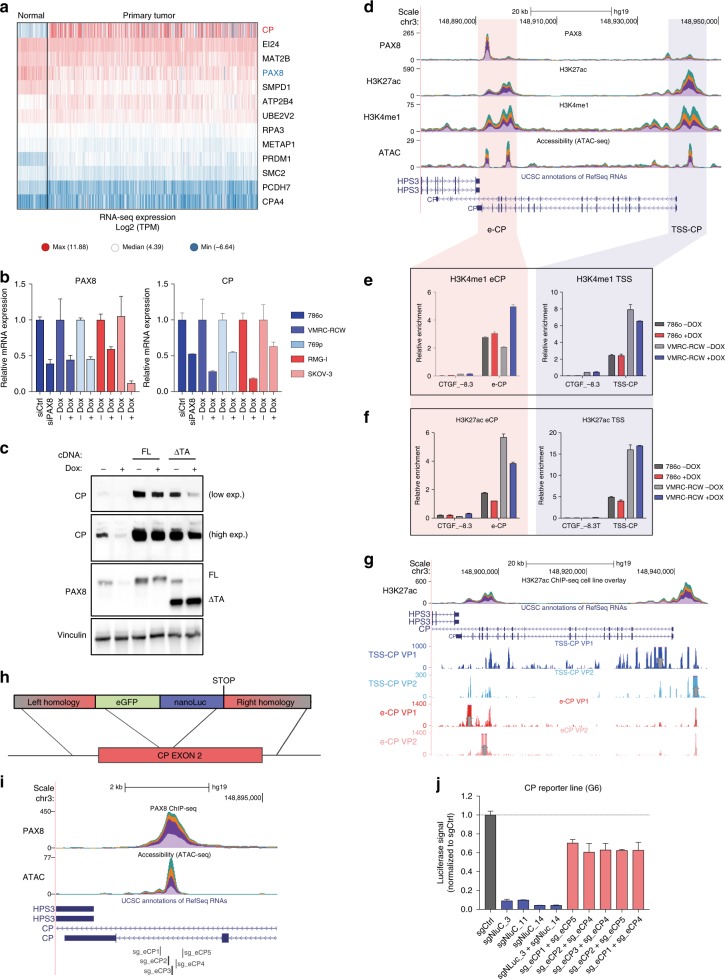
PAX8 regulates CP by favoring histone acetylation at its intragenic enhancer. a Heatmap of RNA-seq expression of the indicated genes (row) from TCGA dataset divided between normal (n = 104) and primary tumor (n = 823) samples. b qPCR for PAX8 (left) and CP (right) in different cell lines upon PAX8 silencing by doxycycline induced shRNA or siRNA. Shades of blue represent RCC cell lines while shades of red represent ovarian carcinoma models. Representative experiment of biological triplicates, error bars represent standard deviation of technical duplicates. c Western blot analysis of PAX8 and CP in 786o cells upon PAX8 knockdown and/or overexpression of a full-length (FL) PAX8 cDNA or PAX8 lacking the c-terminal transactivation domain (∆TA). Vinculin is used as a loading control. d UCSC genome browser tracks of overlaid stacked signal (one color for each of the four cell lines) for PAX8, H3K27ac, H3K4me1, and ATAC-seq centered at the CP locus. Red and Blue vertical shades indicate CP enhancer (e-CP) and CP TSS (TSS-CP) loci respectively. e H3K4me1 ChIP-qPCR at the e-CP (left) and TSS-CP (right) loci in 786o and VMRC-RCW cells upon doxycycline-inducible knockdown of PAX8. CTGF −8.3 locus is used as a negative control region. f H3K27ac analysis at the e-CP and TSS-CP loci, similar to Fig. 3e. Representative experiment of biological quadruplicates. Error bars represent standard deviation of technical triplicates. g UCSC genome browser tracks for 4C signal centered around the CP locus. The viewpoints for each track are indicated with vertical gray arrows. h Schematic diagram for the integration of a reporter cassette into the exon 2 of the CP gene in 769p cells. i UCSC genome browser snapshot representing the location of sgRNAs flanking the e-CP site used in the experiment shown in Fig. 3j. j Luciferase signal of 769p-CP reporter line (clone G6 from Supplementary Fig. 3D) transfected with the sgRNA combinations indicated on the x-axis. Error bars represent standard deviation of biological triplicates

