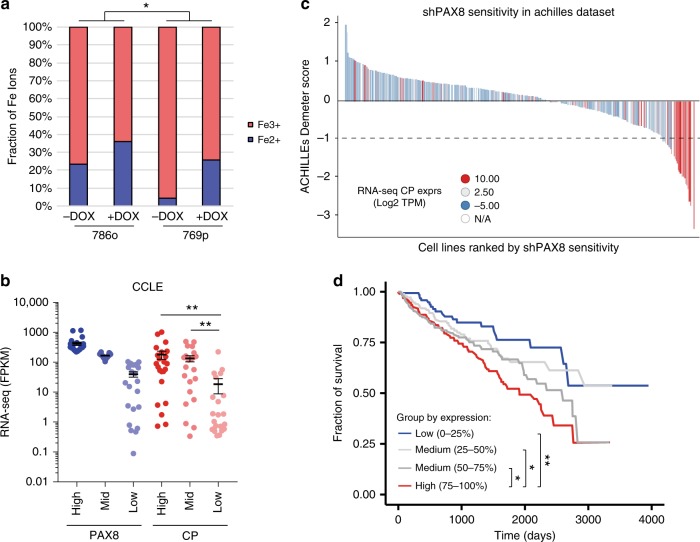
Fig. 4.
CP expression tracks with PAX8 sensitivity and RCC cases with poorer survival. a Iron assay kit measurements of different iron oxydation states in 786o and 769p cells conditioned media upon PAX8 knockdown. *p < 0.05 based on ANOVA test. b RNA-seq expression of PAX8 and CP across the cancer cell line encyclopedia segregated evenly according to PAX8 High, Mid, and Low expression. **p < 0.005 based on Welch’s T-test. c Waterfall plot representing the sensitivity (Demeter score) of cell lines to PAX8 knockdown as reported in the Achille’s project dataset. Each histogram bar is a cell line and bars are color coded based on the CP expression level (by RNA-seq). d Kaplan–Meyer plot representing the survival of TCGA RCC cases segregated based on CP expression (4 equal-sized bins). *p < 0.05 and **p < 0.01 according to Mantel–Cox log-rank test

