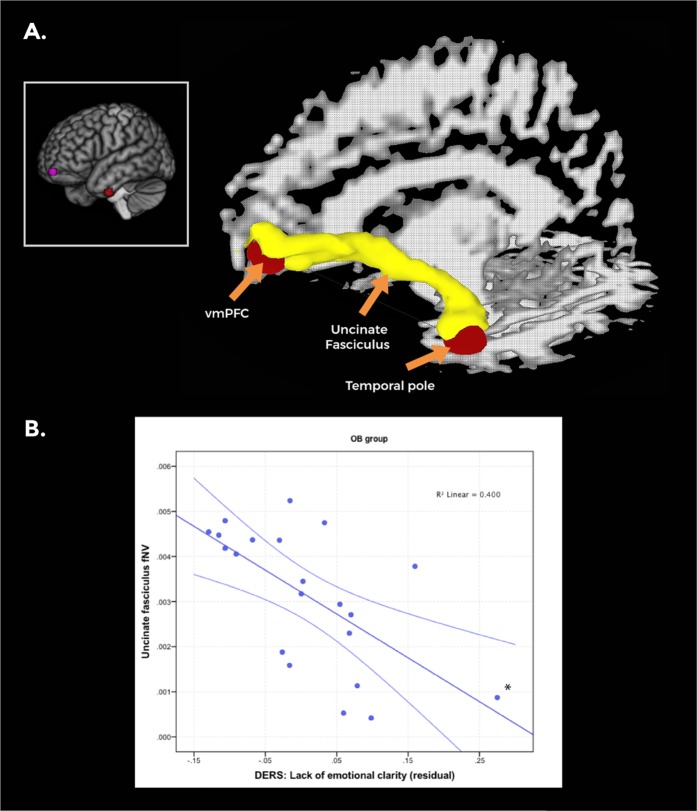
Fig. 3.
a Targets for probabilistic fiber tracking, derived from the resting-state analyses results (featured in the box), included the left ventromedial prefrontal cortex (vmPFC) and the left temporal pole (marked in red). An example of the uncinate fasciculus tracts connecting the vmPFC target with the temporal pole target is shown (marked in yellow). SUMA/AFNI Surface Mapper software was used for DTI image preparation. b A scatterplot depicting the negative correlation between the fractional volume of the left uncinate fasciculus and residual Difficulties in Emotion Regulation Scale (DERS) Lack of Clarity scores in the obese group controlling for age [n = 21, r(19) = −0.624, p = 0.002]. Error bars show the 95% confidence interval (CI). *This correlation remained significant after excluding the highlighted subject (p = 0.003 vs. p = 0.010)

