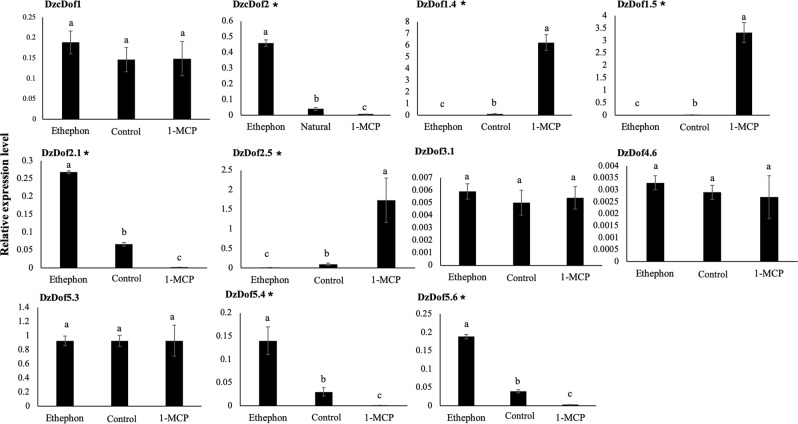
Figure 4.
Expression levels of 11 putative ripening-associated DzDofs under three different ripening treatments: natural (control), ethylene-induced, and 1-MCP-delayed ripening. Gene transcript level was quantified using qRT-PCR. Elongation factor 1 alpha (EF-1α) was used as the reference gene to normalize the expression levels of each other gene. Error bars indicate ± standard deviations (SD). For each DzDof, comparisons were made of its expression levels among three different ripening treatments. Three independent biological replicates were used. Three technical replicates were also performed for each biological replicate. Bars with different letters above them were significantly different according to Duncan’s multiple range test (P < 0.05). The DzDofs marked with asterisks (*) indicate the seven confirmed ripening-associated DzDofs.

