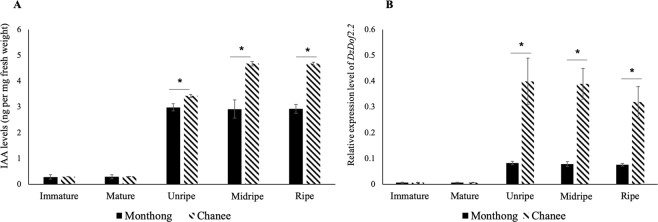
Figure 5.
Indole-3-acetic acid (IAA) and DzDof2.2 expression levels. (A) IAA levels were measured at five different stages (immature, mature, unripe, midripe, and ripe) in both the Monthong and Chanee cultivars. Comparisons were made between the two cultivars at each stage. An asterisk (∗) above the bars indicates a significant difference between cultivars (Student’s t-test, P < 0.05). (B) Expression levels of DzDof2.2 were measured at five different stages (immature, mature, unripe, midripe, and ripe) in both the Monthong and Chanee cultivars. Comparisons were made between the two cultivars at each stage. Three independent biological replicates were used. Three technical replicates were also performed for each biological replicate. An asterisk (∗) above the bars indicates a significant difference between cultivars (Student’s t-test, P < 0.05).

