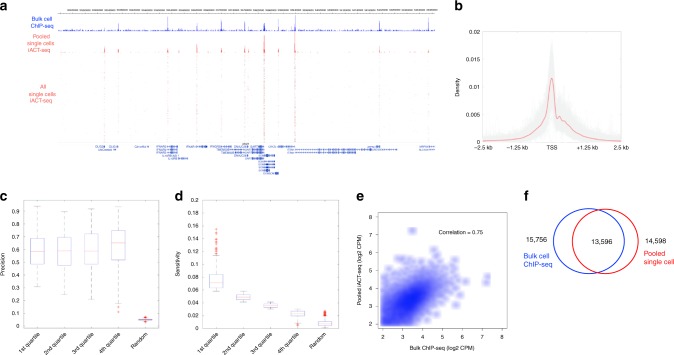
Fig. 2.
ACT-seq reproducibly maps epigenetic marks in single cells. a Genome browser image of H3K4me3 peaks from bulk-cell ChIP-seq (blue) and pooled iACT-seq (red). The mapped reads from all 1246 individual cells are plotted below the aggregate peaks. Each row represents a single cell. b Metagene profile of H3K4me3 enrichment at the TSS region of genes from the hg18 genome for all single cells. The red line indicates average enrichment for all single cells from the iACT-seq data set. c, d Precision and sensitivity plots for the H3K4me3 scACT-seq data set. These values were calculated in the same manner as was done previously16. Data are divided into quartiles with the central marks indicating the median values. The bottom and top edges of the boxes indicate the 25th and 75th percentiles, respectively. The whiskers indicate the boundaries of the data. e Scatter plots depicting the correlation in H3K4me3 peak enrichment in counts per million (CPM) between ENCODE bulk-cell ChIP-seq data (x-axis) and pooled scACT-seq data (y-axes). Peaks identified as enriched using both the ChIP-seq and scACT-seq methods were included. f Venn diagram indicating the numbers of significantly enriched H3K4me3 peaks with at least 1 bp overlap between a bulk-cell ENCODE ChIP-seq data set (blue) and pooled scACT-seq data (red)

