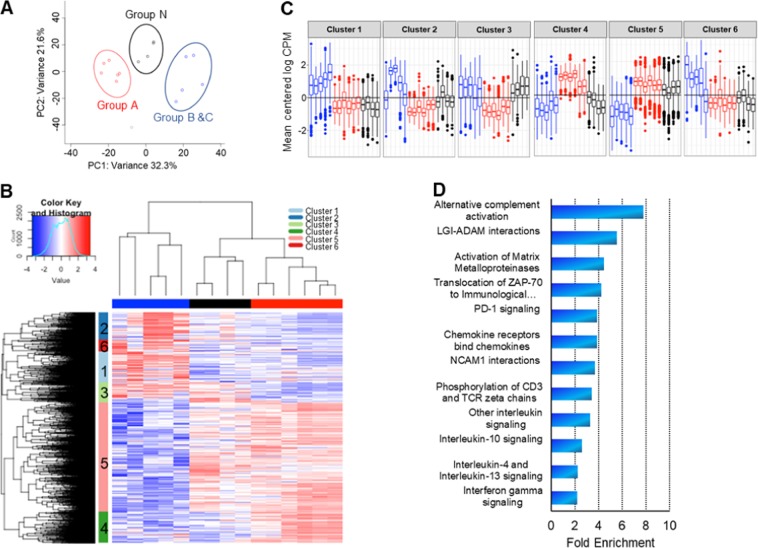
Fig. 5. Prostate cancers with elevated Δ133TP53β expression show immune and invasive gene signatures.
a Principal component analyses of 1000 genes with maximum variance determined by RNA-seq of 12 prostate cancers and 4 normal associated tissues. Red—Group A cancers, Blue—Group B and C cancers, and Black—Group N (normal associated tissue). b Unsupervised clustering of differentially expressed genes (log fold change ≥1.0 and ≤–1.0 and FDR < 0.05) between Groups N, A and B/C. The vertical bar shows the clusters of genes either up or downregulated across the different groups. Columns—Sample, Row—gene. c Shows the mean centred log CPM (log2-counts per million) of genes in each cluster identified by unsupervised hierarchical clustering. Group A – Red, Group B/C—Blue and Group N—Black. d Shows fold enrichment of immune and invasive pathways in clusters 4 and 5 using Pantherdb

