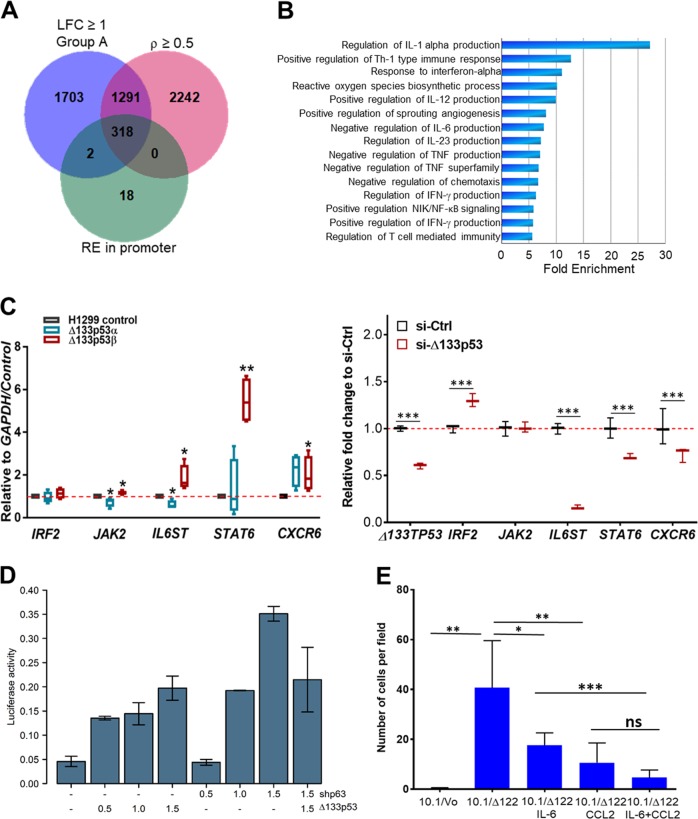
Fig. 7. ∆133p53 isoforms regulate genes involved in immune cell activity and recruitment.
a Venn diagram showing genes differentially regulated in Group A prostate cancers, containing p53/p63/p73 response elements in their promoters and are associated with Δ133TP53β mRNA expression (Spearman's correlation coefficient cutoff of ρ > 0.5). b Bar graph depicting a selected list of pathways (PantherdB) with >5 fold enrichment and FDR < 0.05. c Expression of selected genes in left panel: four clonal lines expressing Δ133p53α or Δ133p53β isoforms compared to control p53-null H1299 cells, right panel: 22Rv1 cells 48 h after knockdown of Δ133p53. Box (median ± 25th–75th percentile), and whiskers show the 10–90% CI. *p < 0.05, **p < 0.01 and ***p < 0.001, as determined by paired one-tailed t-test. d Transcriptional activation of the IL-6 promoter by Δ133p53 or by inhibiting TP63 (shp63). Cells were transiently transfected with 1.0 µg of IL-6 luciferase reporter plasmid and varying amounts of either Δ133p53 or shp63. Luciferase activity was determined and is normalized to cell number. Bars represent the mean and error bars are ± SD; n = 4 biological replicates. e 10.1/vector and 10.1/Δ122 cells treated with blocking antibody against either IL-6, CCL2 or both IL-6 (2.0 μg) and CCL2 (3.0 μg). Cells were allowed to migrate for 4 h then membranes were fixed, stained, imaged and quantified. Three technical replicate counts of cells per field were combined and are shown as mean ± SEM. Significance was determined as *p < 0.05, **p < 0.01, ***p < 0.005 using unpaired t-tests. ns not significant

