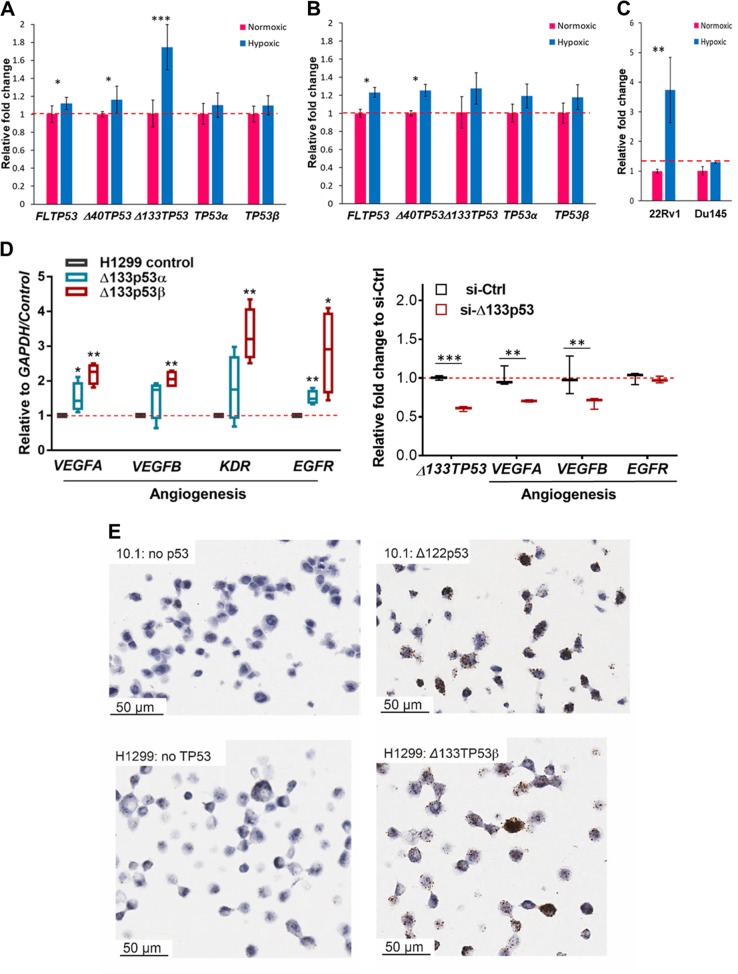
Fig. 8. Hypoxia induces expression of the Δ133TP53 isoform in prostate cancer cells with wild-type p53.
Bar plots show relative TP53 variant expression in a 22Rv1 and b DU145 cells and in c. VEGFA expression in prostate cancer cell lines cultured under hypoxic conditions (1% O2) for 24 h (blue boxes) compared to those cultured under normoxic conditions (red boxes). *p < 0.05 and ***p < 0.001 as determined by paired one-tailed t-test. d Expression of selected genes involved in angiogenesis in: left panel: four clonal lines expressing either Δ133p53α or Δ133p53β isoforms compared to control p53-null H1299 cells, right panel: 22Rv1 cells 48 h after knockdown of Δ133p53. Box (median ± 25th–75th percentile), and whiskers show the 10–90% CI. *p < 0.05, **p < 0.01 and ***p < 0.001, as determined by paired one-tailed t-test. e In situ hybridization using RNAscope to detect VEGFA mRNA. Top panel: the mouse p53-null fibroblast cell line 10.1 transduced with a retrovirus expressing Δ122p53 or the control vector. Bottom panel: control H1299 and Δ133p53β expressing cells

