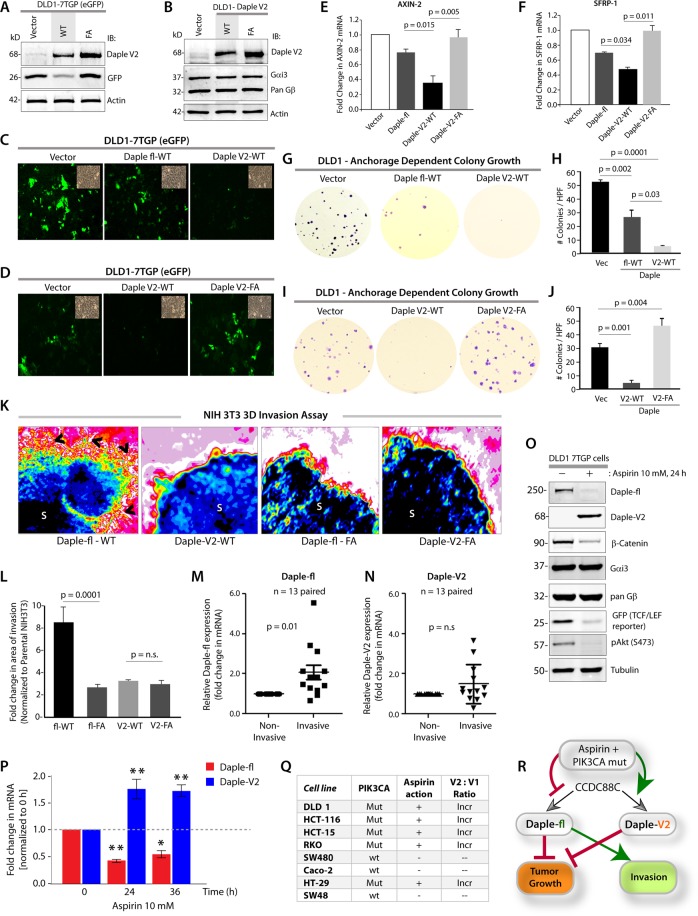
Figure 4.
Daple-V2 and -fl have differential effects on tumor cell growth, β-Catenin/TCF/LEF pathway and cell invasion and are differentially expressed in response to Aspirin. (A) Whole cell lysates of DLD1 cells stably co-expressing the 7TGP reporter and either vector control or Daple-V2 were analyzed for Daple-V2, GFP and actin by immunoblotting (IB). The intensity of GFP indicates the extent of β-Catenin/TCF/LEF signals. (B) Whole cell lysates of DLD1 cells stably expressing vector control, Daple-V2 WT or FA were analyzed for Daple-V2, Gαi3, pan Gβ and actin by immunoblotting (IB). (C,D) Monolayers of DLD1 7-TGP cell lines in A were starved and stimulated with Wnt5a. Images display representative fields analyzed by fluorescence microscopy. The intensity of eGFP signals denotes Wnt transcriptional activity. Insets show representative fields confirming the confluency of the monolayers in each case. In C, compared to DLD1 cells expressing vector control, both Daple-fl-WT and Daple-V2-WT showed inhibition of eGFP; inhibition with Daple-V2 was more robust. In D, Daple-V2-WT, but not Daple-V2-FA inhibited eGFP. (E,F) HeLa cells transfected with myc-Daple constructs as indicated were analyzed for AXIN-2 and SFRP-1 mRNA by qPCR. Results were normalized internally to mRNA levels of the housekeeping gene, GAPDH. Bar graphs display the fold change in each RNA normalized to the expression in cells expressing control vector. Error bars represent mean ± S.D of 3 independent experiments. (G–J) Monolayers of DLD1 cells in (B) were analyzed for their ability to form adherent tumor cell colonies on plastic plates during 2–3 weeks prior to fixation and staining with crystal violet. In panels G and I, photographs of representative wells of the crystal violet-stained 6-well plates are displayed. The number of colonies was counted by ImageJ (Colony counter). In panels (H,J), bar graphs display the # of colonies per well seen in each cell line in (G,I), respectively. Panels (G,H) show that both Daple-fl and Daple-V2 can inhibit tumor growth. Panels (I,J) show that the GBA motif of Daple-V2 is required for the inhibition of anchorage-dependent colony growth. (K,L) Spheroids (S) of NIH3T3 cells expressing WT or FA mutant of myc-Daple-fl or myc-Daple-V2 isoform were analyzed for their ability to invade matrigel in response to Wnt5a (100 ng/ml) using a Cultrex-3D Spheroid Invasion Kit (Trevigen). Representative images of spheroid edges are displayed (K). An increase of invasion tracks (arrowheads) was noted only from the edge of tumor spheroids formed by cells expressing myc-Daple-fl-WT, but not the GEF-deficient F1675A (FA) mutant. Neither the WT nor the FA mutant of Daple-V2 could trigger invasion. Area of invasion was quantified using ImageJ and displayed as bar graphs (L). Error bars represent mean ± S.D of 3 independent experiments. (M,N) Paired samples from non-invasive center and the invasive edges of colorectal cancers were analyzed for Daple-fl (M) and Daple-V2 (N) expression by qPCR. Scatter plot displays the relative abundance of Daple expression. Daple-fl, but not Daple-V2 is increased in the invading margins of tumors compared to the non-invasive tumor cores. Error bars represent mean ± S.D. n = 13. (O). Immunoblots showing the impact of low dose Aspirin on endogenous Daple isoforms expressed by DLD1-7-TGP cells. β-Catenin and GFP were assessed as positive controls; the abundance of GFP serves as a surrogate marker for the transcriptional activity of β-Catenin via the TCF/LEF axis. G proteins, Gα and β-subunits were assessed as negative controls. (P) Parental DLD1 cells were analyzed for Daple-fl and Daple-V2 mRNA by qPCR at indicated time points after exposure to 10 mM Aspirin. Bar graphs display the fold change in each mRNA (Y axis) normalized to the expression levels at 0 hour. Error bars represent mean ± S.D of 3 independent experiments. p values: *=<0.05; **<0.01. (Q) Table summarizing the various CRC cell lines, their PIK3CA status50, their sensitivity to the anti-proliferative action of Aspirin15, and the impact of Aspirin on the ratio of Daple-V2:Daple-fl transcripts (see Supplementary Fig. 6). Mut = mutant; + = significant growth suppression when exposed to Aspirin15; Incr = increased. (R) Schematic summarizing the effect of the recently discovered GBA motif in Daple-fl and Daple-V2 on tumor growth and tumor invasion, and how Aspirin alters the levels of expression of each isoform. The GBA motif of Daple-fl inhibits tumor growth and enhances tumor invasion, whereas the GBA motif of Daple-V2 exclusively inhibits tumor growth. Red lines = Inhibition. Green lines = Enhancement. Thickness of the lines depicts the relative strength of phenotypes.

