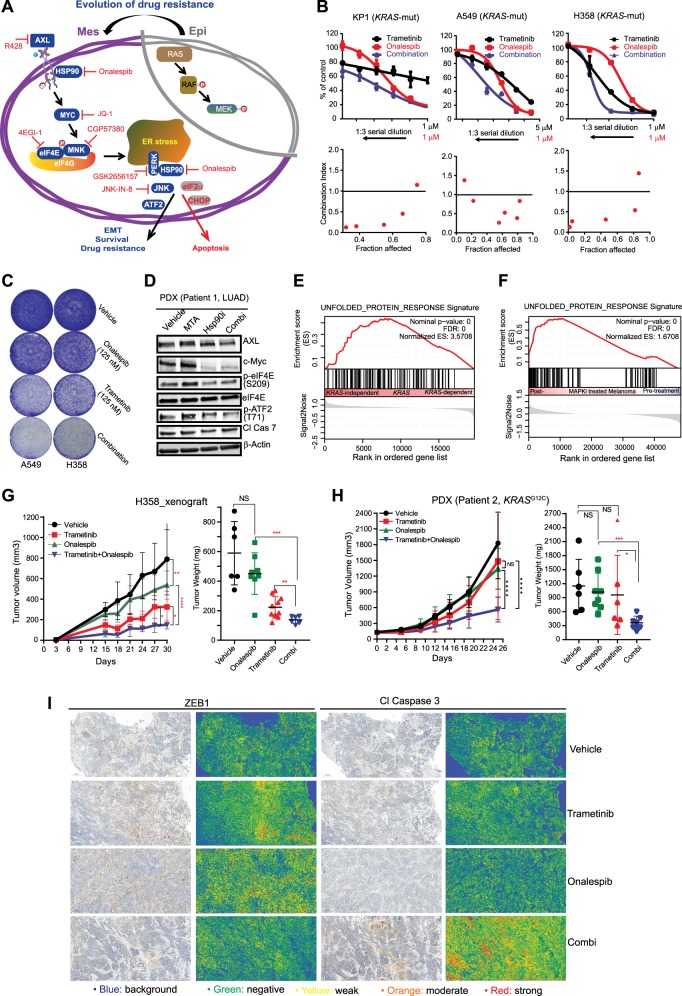
Fig. 4. HSP90 antagonism enhances antitumor effects of MTA and trametinib in preclinical cancer models.
a Schematic overview of acquired vulnerabilities resulting from drug resistance. Epi epithelial cell state, Mes mesenchymal cell state. b Growth inhibition of KRAS-mutant murine (KP1) and human (A549, H358) lung adenocarcinoma cell lines after treated with trametinib, MTA, and onalespib, alone or in combinations. Each drug was dosed at the indicated concentrations for single treatment or mixed following threefold serial dilutions for combination treatment. Data are mean ± s.d. of three biological replicates (n = 3). Plots of fraction affected (Fa) versus combination index (CI) was determined by the CompuSyn software. CI < 1 indicates synergism. c HSP90 inhibition enhances trametinib effectiveness by preventing adaptive drug resistance. H358 and A549 cells treated (24 h) with onalespib and trametinib, alone or in combination, were washed with PBS and subjected to further culture for additional 10 days in the absence of the drug. d Immunoblots of a lung adenocarcinoma patient (patient 1)-derived xenograft tumors cultured ex vivo and treated with vehicle, pemetrexed (1 µM), and onalespib (0.5 µM), alone or in combination for 24 h. e, f GSEA of KRAS-mutant cancer cell lines (e) and matched tumor samples (pre- and post-treatment with MAPK inhibitors) of patients with BRAF-mutant melanoma (f) show significant enrichment of UPR gene signatures in KRAS-independent cell lines (e) and in residual melanoma that survived BRAF inhibitors (f). The GEO dataset GSE15126 and GSE65185 were used for the analysis. g, h Volumes of H358 xenografts (g) and a KRAS-mutant lung cancer patient (patient 2)-derived xenograft model (h) treated with vehicle or the indicated drugs. *p < 0.05, **p < 0.01, ****p < 0.0001 by two-way ANOVA. Tumor weights at the end of the treatment are shown to the right. *p < 0.05, **p < 0.01, ****p < 0.0001 by unpaired two-sided t-test. i Immunohistochemistry (IHC) analysis for EMT (ZEB1) and apoptosis (Cl caspase 3) in H358 xenograft tumors after treated with the indicated drugs. Original overall magnification ×100 (scale bar: 200 μM). Images were taken and processed using CaseViewer software. Both the original IHC slides and the corresponding slides with gradient map visualization were shown. Blue: insignificant (background); green: moderate significant; yellow: significant; orange: more significant; red: most significant

