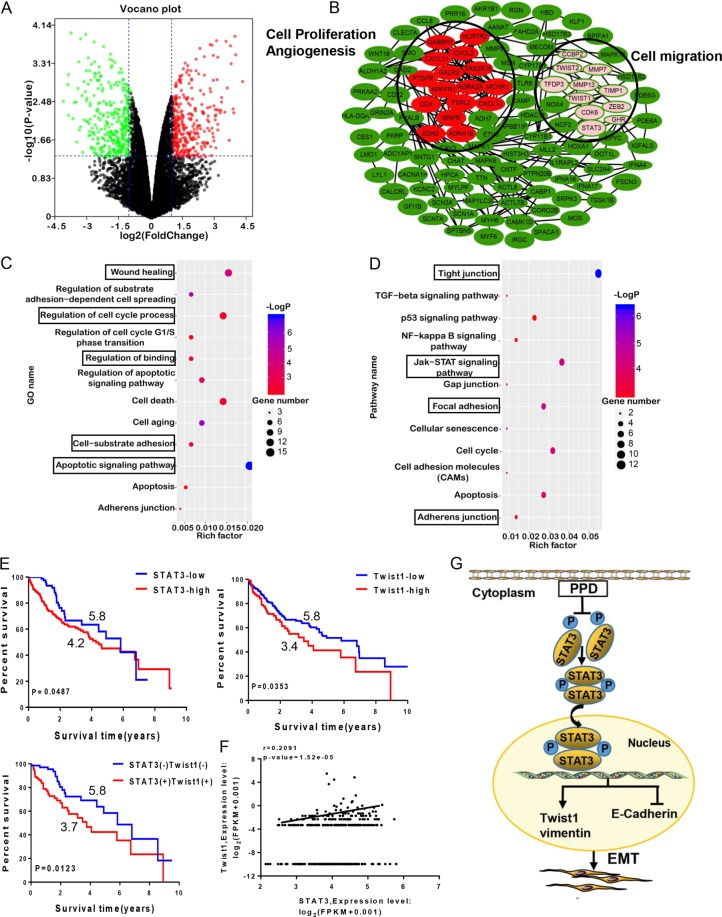
Fig. 6. Bioinformatic analysis of PPD and survival analysis of key proteins in HCC.
a Volcano plot of the differentially expressed proteins between PPD-treated and untreated cancer cells. Red and green dots indicate the up- and downregulation of proteins, respectively. b Protein interaction network of PPD. c GO analysis of differentially expressed proteins. d KEGG analysis of differentially expressed proteins. e Kaplan–Meier curve showing the 10-year survival of TCGA LIHC samples classified by STAT3 or Twist1 expression. The correlation coefficient and P value are shown. f Correlation analysis of STAT3 with Twist1 in TCGA LIHC samples. The correlation coefficient and P value are shown. g Schematic diagram of PPD blockage possible mechanism in EMT via targeting STAT3/Twist1 signaling

