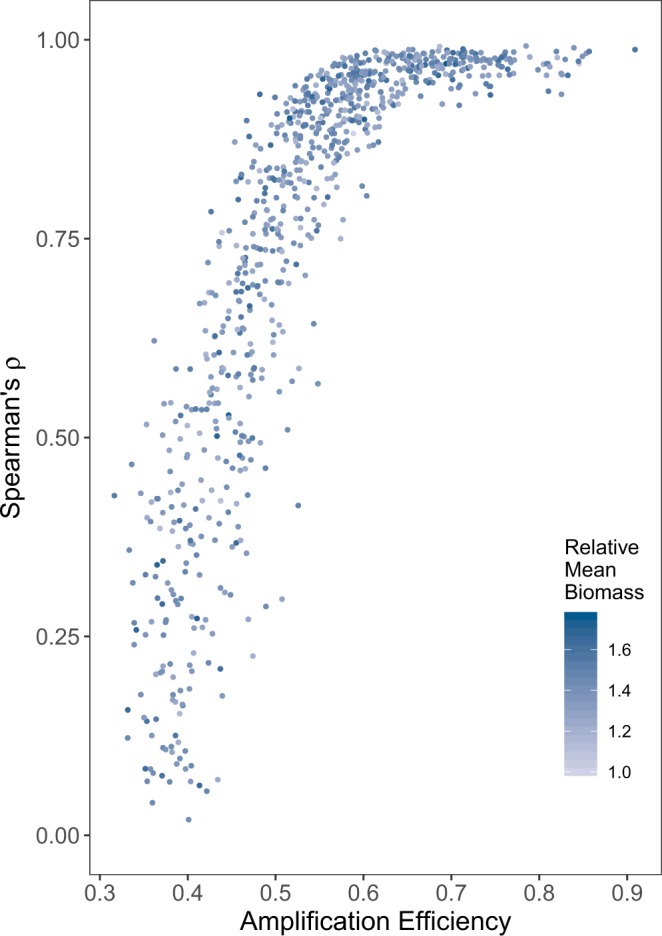
Figure 8.

Using the eDNA Index, the biomass-index correlation coefficient (ρ) by amplification efficiency for each amplified taxon. Those taxa with a relative amplification efficiency >= 0.6 have particularly strong correlations (median ρ = 0.96). As shown by shading, the eDNA Index behaves similarly for species with greater and lesser proportions of biomass in the community. Simulated biomass varied over two orders of magnitude across taxa; averaging across time-points narrows this range to a factor of two, and the relative mean biomass expressed here reflects that smaller range.
