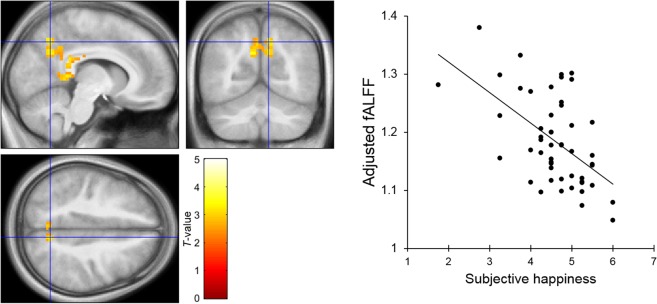
Figure 1.
Brain regions showing a significant negative association between the subjective happiness score and fractional amplitude of low-frequency fluctuation (fALFF) value. (Left) A statistical parametric map (p < 0.05, cluster-level family-wise error corrected) for the group analysis of the fALFF map. The area is overlaid on the mean spatially normalized structural magnetic resonance images. The blue cross indicates the location of the peak voxel (x = 3, y = −72, z = 36). The red–white color scale indicates the T-values. (Right) A scatter plot of the adjusted fALFF values as a function of the subjective happiness score at the peak voxel. Effects of no interest (age, sex, full-scale intelligence quotient, and mean framewise displacement) were regressed out.

