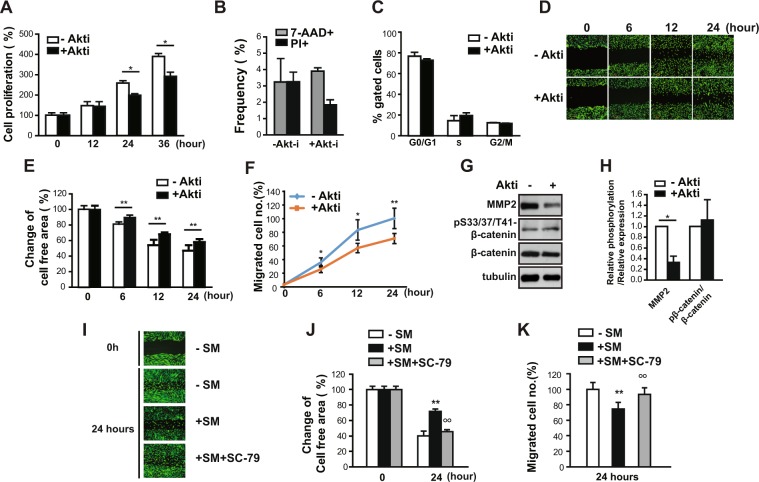
Figure 4.
Akt decreased cell growth and migration in human eSCs. (A) Human eSCs were incubated with or without 1 μM Akti for the indicated times. The cells were counted using a cell counter. (B) The cells were treated as in (A), stained with either 7-AAD or PI, and analyzed by flow cytometry. (C) The cells were treated as in (A), stained with PI, and analyzed by flow cytometry. (D–F) The cells were scratched with a T200 tip and then incubated with or without 1 μM Akti for the indicated times. (D) The cells were stained using the CytoPainter Cell Tracking Staining Kit and photographed. (E) The cell-free area was measured using ImageJ and change of cell-free area was calculated. (F) The number of migrated cells was counted using ImageJ. (G,H) The cells were treated as in (A), lysed, and subjected to western blotting. (H) Western blot images were analyzed using ImageJ to determine the phosphorylation of pS33/37/T41-β-catenin relative to β-catenin and the expression of MMP-2 relative to tubulin. (I–K) The cells were scratched with a T200 tip and incubated with or without 0.2 μg/ml SC-79 under SM conditions for 24 h. (I) The cells were stained using the CytoPainter Cell Tracking Staining kit and photographed. (J) Cell-free areas were measured using ImageJ and the changes in the cell-free areas were calculated. (K) The number of migrated cells was counted using ImageJ. Abbreviations: simulated microgravity (SM); 7-aminoactinomycin D (7-AAD); propidium iodine (PI). Data are expressed as mean ± SD, with paired t-tests performed as indicated. *P < 0.05, **P < 0.01 versus control at each indicated time; °°P < 0.01 versus SM exposed cells.

