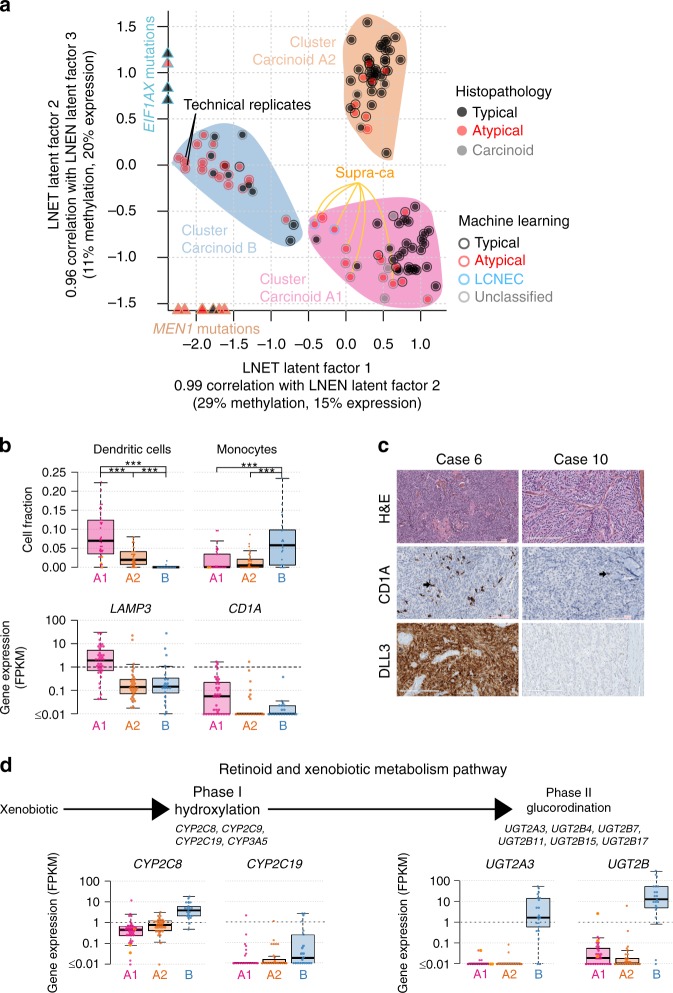
Fig. 4.
Multi-omics unsupervised analysis of lung neuroendocrine tumours. a Multi-omics factor analysis (MOFA) of transcriptomes and methylomes restricted to LNET samples (pulmonary carcinoids). Design follows that of Fig. 1a; filled coloured shapes represent the three molecular clusters (Carcinoid A1, A2, and B) identified by consensus clustering. The position of samples harbouring mutations significantly associated with a latent factor (ANOVA q-value < 0.05) are highlighted by coloured triangles on the axes. b Upper panel: boxplots of the proportion of dendritic cells in the different molecular clusters (Carcinoid A1, A2, and B) and the supra-carcinoids, estimated from transcriptomic data using quanTIseq (Methods). The permutation test q-value range is given above each comparison: q-value < 0.001 is annotated by three stars. Lower panel: boxplots of the expression levels of LAMP3 (CDLAMP) and CD1A. c DLL3 and CD1A immunohistochemistry of two typical carcinoids: case 6 (DLL3+ and CD1A+), and case 10 (DLL3- and CD1A-). Upper panels: Hematoxylin & Eosin Saffron (H&E) stain. Middle panels: staining with CD1 rabbit monoclonal antibody (cl EP3622; VENTANA), where arrows show positive stainings. Lower panels: Staining with DLL3 assay (SP347; VENTANA). d Expression levels of genes from the retinoid and xenobiotic metabolism pathway—the most significantly associated with MOFA latent factor 1—in the different molecular clusters. Upper panel: schematic representation of the phases of the pathway. Lower panel: boxplot of expression levels of CYP2C8 and CYP2C19 (both from the CYP2C gene cluster on chromosome 10), UGT2A3, and the total expression of UGT2B genes (from the UGT2 gene cluster on chromosome 4), expressed in fragments per kilobase million (FPKM) units. In all panels, boxplot centre line represents the median and box bounds represent the inter-quartile range (IQR). The whiskers span a 1.5-fold IQR or the highest and lowest observation values if they extend no further than the 1.5-fold IQR. Data necessary to reproduce the figure are provided in Supplementary Data 1, 4, 9, and in the European Genome-phenome Archive

