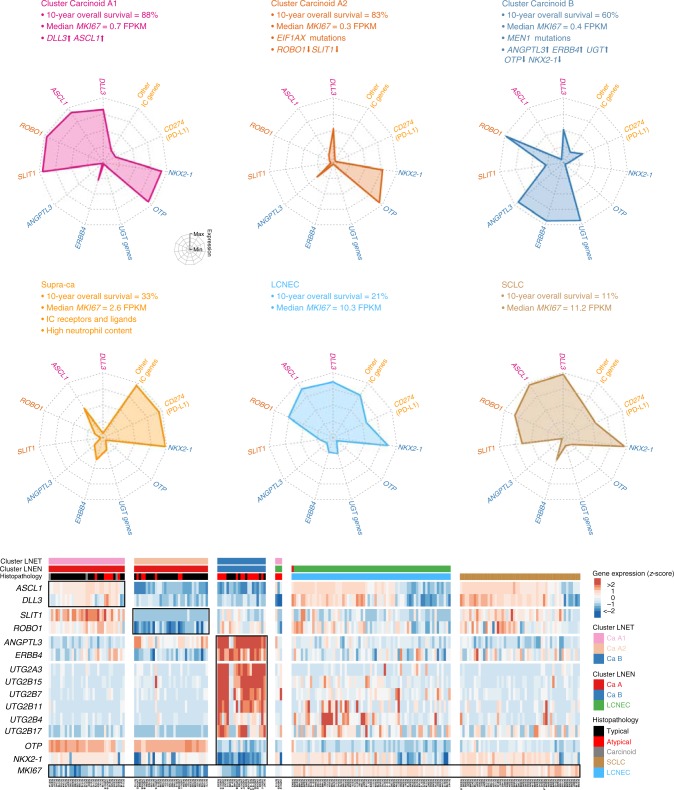
Fig. 6.
Main molecular and clinical characteristics of lung neuroendocrine neoplasms. Upper panel: Radar charts of the expression level (z-score) of the characteristic genes [DLL3, ASCL1, ROBO1, SLIT1, ANGPTL3, ERBB4, UGT genes family, OTP, NKX2-1, PD-L1 (CD274), and other immune checkpoint genes] of each LNET molecular cluster (Carcinoid A1, Carcinoid A2, and B clusters), supra-ca, LCNEC, and SCLC. The coloured text lists relevant characteristics—additional molecular, histopathological, and clinical data—of each group. Lower panel: heatmap of the expression level (z-score) of the characteristic genes of each group from the left panel, expressed in z-scores. Data necessary to reproduce the figure are provided in the European Genome-phenome Archive

