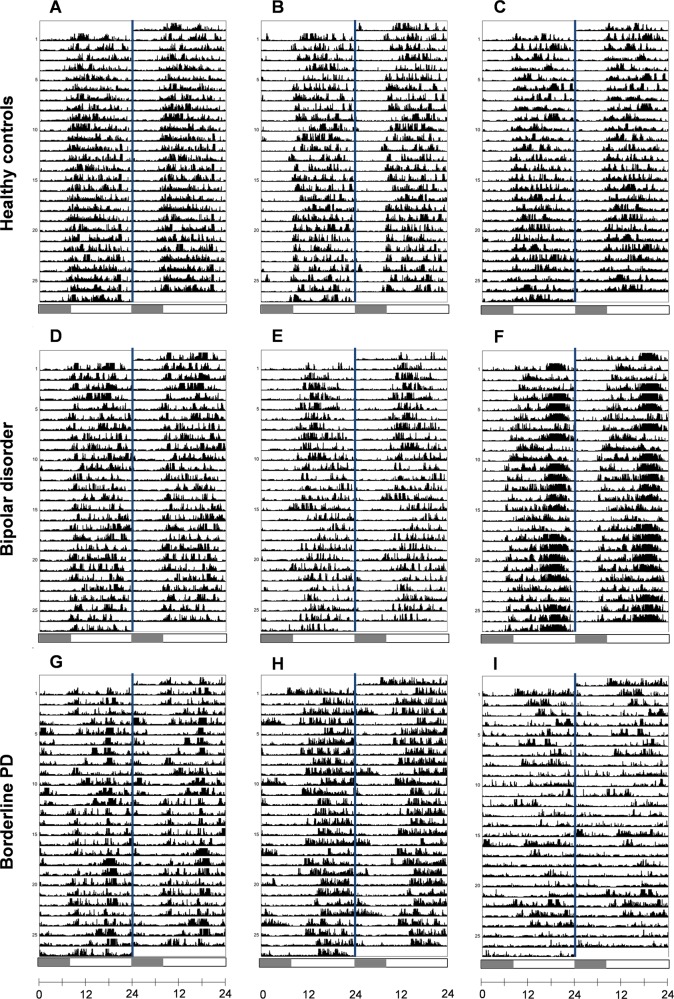
Fig. 3. Representative actograms of rest-activity patterns.
Visual inspection of double-plotted 24-h actograms generated from participants’ rest-activity patterns reflect the characteristic differences detected between study groups. Actograms from individuals in the control group (a–c) show organized entrainment to the day/night cycle with phase and amplitude of the rest-activity rhythm remaining stable between days. Patterns show entrainment to the typical day/night cycle with stable phase and amplitude visible between days. Slight phase shifts on weekends can be detected illustrating how rest-activity patterns are shaped by social imperatives (e.g., b). The middle row reveals a similar pattern in bipolar individuals demonstrating robustly entrained patterns (d) with some changes on weekends (e). An example of a participant with low IV (f) shows greater consolidation of activity during the late evening which is stable throughout the recording period, consistent with delayed daily activation previously described in BD. Most striking are the activity patterns of BPD participants (g–i) that show significant phase delay of rest-activity patterns relative to other groups. Individual actograms reveal greater activity in the late night and later activity offsets accompanied by delayed activity onsets during the day. The relative amplitude and interdaily stability were also more variable between individuals in this group (e.g., panel I). Shaded portion of scale bar represents interval between 00:00 and 08:00 h as a reference guide. Actograms were generated using ActogramJ (http://actogramj.neurofly.de/)

