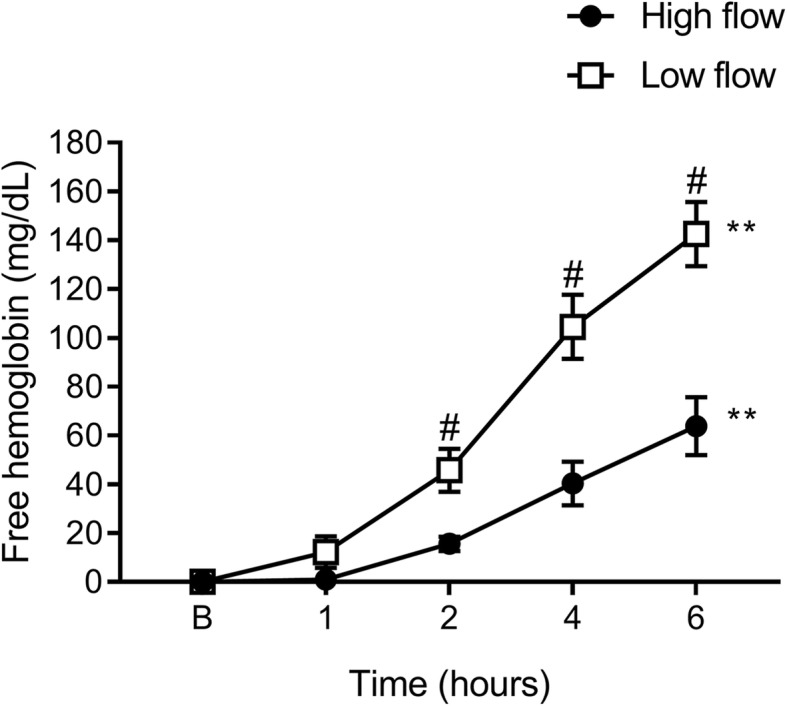
Fig. 2.

Time-dependent haemolysis with different blood flow regimens. Haemolysis levels were significantly increased over time from baseline to 6 h with both high and low-flow rates. Significant differences also were evident between high- and low-flow at 2, 4 and 6 h. Data are presented as mean ± SEM. **p < 0.01 from baseline to 6 h; #p < 0.05 high vs. low flow. n = 5 high flow, n = 4 low flow
