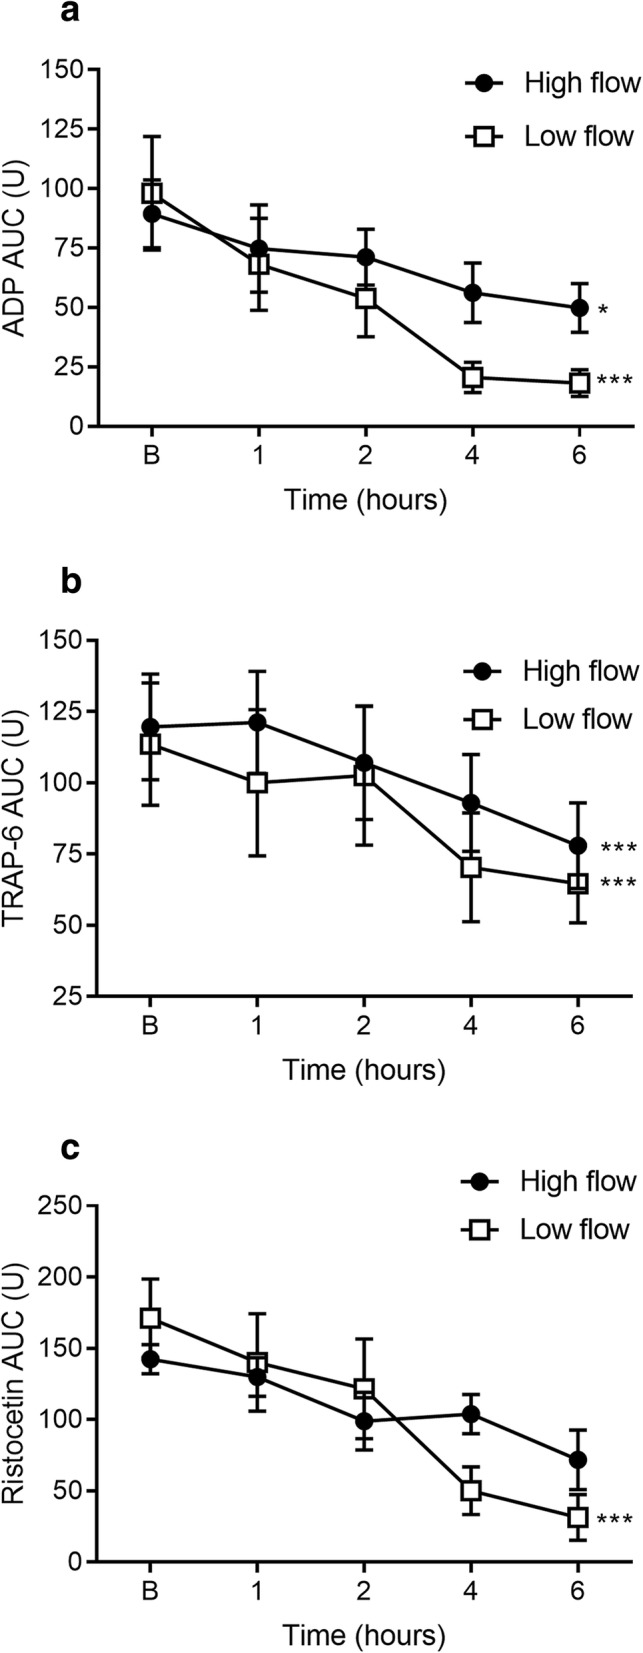
Fig. 3.

Platelet aggregometry function measured at discrete time points. ADP- (a) and TRAP-induced (b) platelet aggregation area under the curve (AUC) was significantly decreased over time from baseline to 6 h with both high and low flow. RISTO-induced platelet aggregation (c) was significantly decreased over time from baseline to 6 h with low flow only. Data are presented as mean ± SEM. *p < 0.05; ***p < 0.001 from baseline to 6 h. n = 5 high flow, n = 5 low flow
