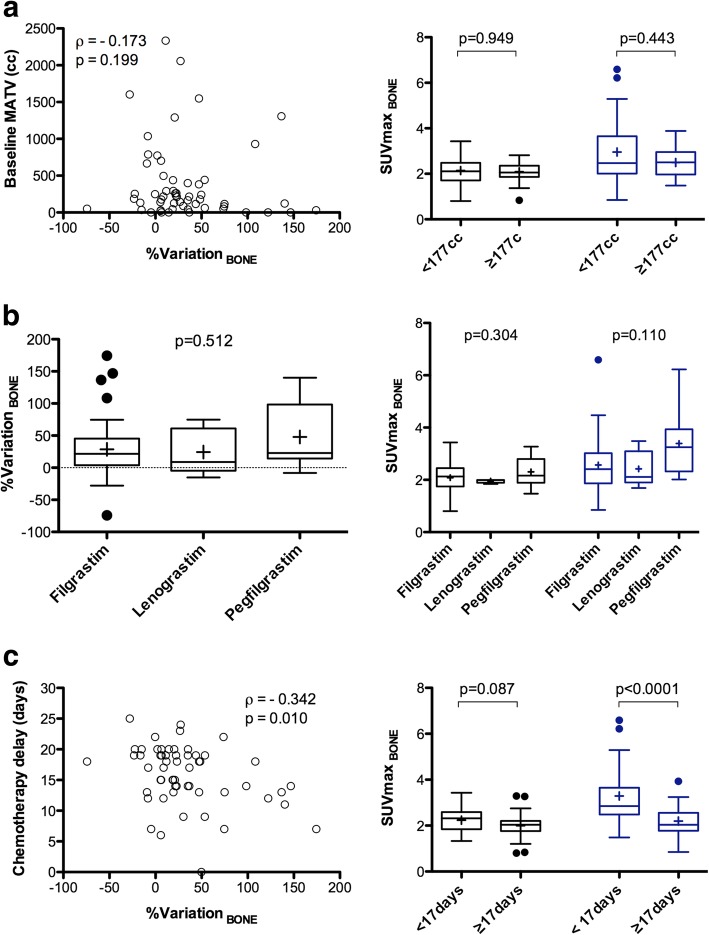
Fig. 1.
Percentage variation (right panels) or absolute value (left panels) for bone marrow uptake between baseline and interim PET/CT, depending on the metabolic active tumour volume (MATV) on baseline scan (a), the type of G-CSF (b), and the time-lapse between the last injection of chemotherapy and the PET/CT examination (c)

