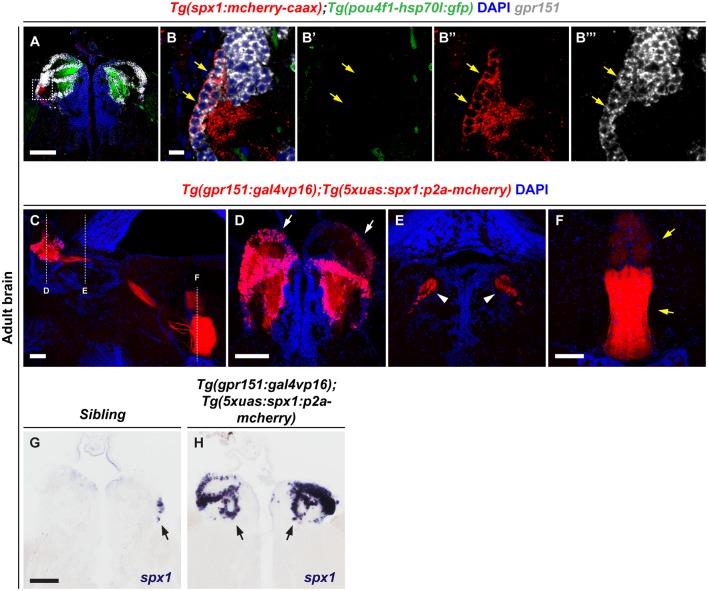
Figure 1.
Overexpression of spx1 in the dorsal habenula (dHb). Panels (A–B”’) Transverse sections of the habenula of Tg(spx1:mCherry-CAAX);Tg(pou4f1-hsp70l:gfp) zebrafish labeled by gpr151 RNA probe and DAPI. The dorsal aspect is toward the top. Panels (B–B”’) are high magnification images of the box area in (A). The yellow arrows indicate the spx1+/gpr151+/pou4f1− cells in the dHb. (C–F) Representative images of the adult brain of Tg(gpr151:gal4vp16);Tg(5xuas:spx1:p2a-mcherry) zebrafish stained with DAPI. (C) Sagittal section view. The dorsal aspect is to the top and the anterior is to the left. Each dotted line marks the transverse section views of every brain region. (D–F) Transverse section views. The dorsal aspect is toward the top. (D) The habenula. The white arrows indicate mCherry fluorescence in the dHb. (E) The fasciculus retroflexus (FR). The white arrowheads indicate mCherry fluorescence in the FR. (F) The interpeduncular nucleus (IPN). The yellow arrows indicate mCherry fluorescence in the IPN. (G,H) Transverse section views of the habenula in Tg(gpr151:gal4vp16);Tg(5xuas:spx1:p2a-mcherry) zebrafish and their wildtype siblings labeled by whole-mount in situ RNA hybridization with an spx1 RNA probe The black arrows indicate spx1 mRNA expression in the habenula. Scale bar: 100 μm in (A,C,D–H) and 10 μm in (B–B”’).

