Figure 2.
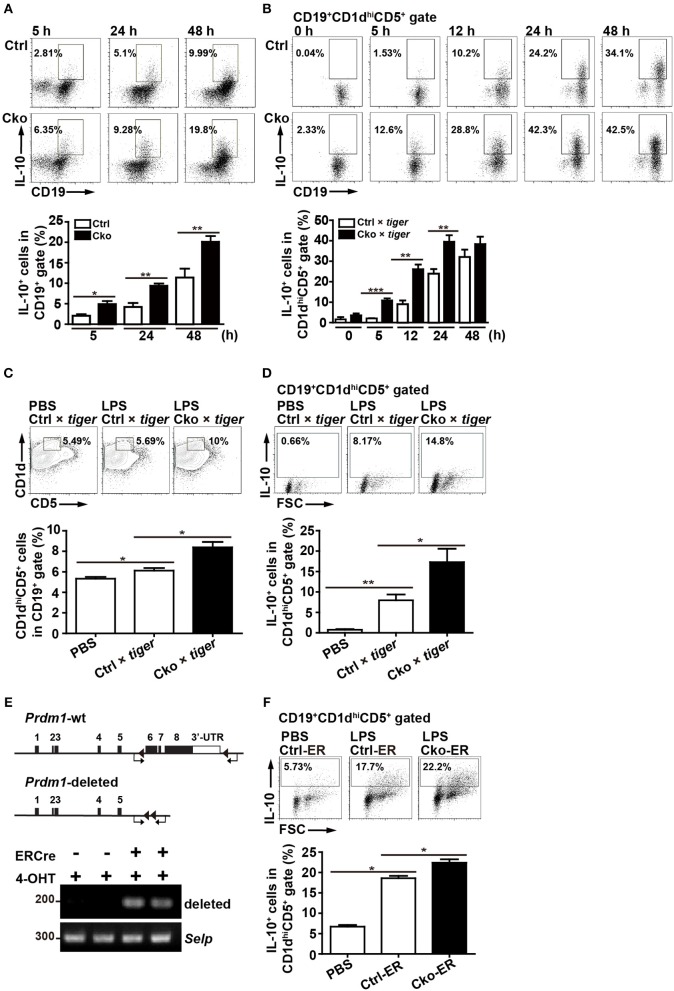
Splenic B10 population in Ctrl and Cko mice. (A) Splenic B cells were purified from Prdm1f/fCD19cre/+mice (Cko) or control littermates (Prdm1f/fCD19+/+, Ctrl) and then stimulated with LPS (10 μg/ml) for 5–48 h. PMA, ionomycin, and monensin (PIM) were added into culture for the final 5 h for intracellular staining of IL-10. The results represent the frequency of IL-10-producing cells in the CD19+ gate. Data are the mean ± SEM (n = 3–6 mice per group). (B) Il-10 reporter mice, tiger, were crossed with Cko and Ctrl mice. Splenic B cells were purified from the Cko × tiger or Ctrl × tiger mice and then stimulated with LPS (10 μg/ml) for 5–48 h before use in an analysis of the frequency of GFP+ B10 cells. (C,D) Cko × tiger or Ctrl × tiger mice were given LPS (1.25 μg/g of body weight). B10 cells (C) and IL-10+ (GFP+) B10 cells (D) in Cko × tiger or Ctrl × tiger mice were analyzed at the indicated days. A PBS-injected group was used as the control. Data are the mean ± SEM (n = 3 mice per group). (E) PCR analysis of indicated genomic DNA isolated from splenic B220+ B10 cells of Cko-ER and littermate control Ctrl-ER mice 14 days after injection with 4-OHT. Primers used for the detection of Prdm1 deletion were indicated by arrows. (F) Fourteen days after 4-OHT injection, Cko-ER and Ctrl-ER mice were injected with LPS (1.25 μg/g of body weight). IL-10+ B10 cells were then analyzed 3 days later by FACS analysis. Data are the mean ± SEM (n = 3 mice per group). A PBS-injected group was used as the control. Results are from at least two independent experiments and were analyzed using an unpaired Student's t-test. *p < 0.05, **p < 0.01 and ***p < 0.001.

