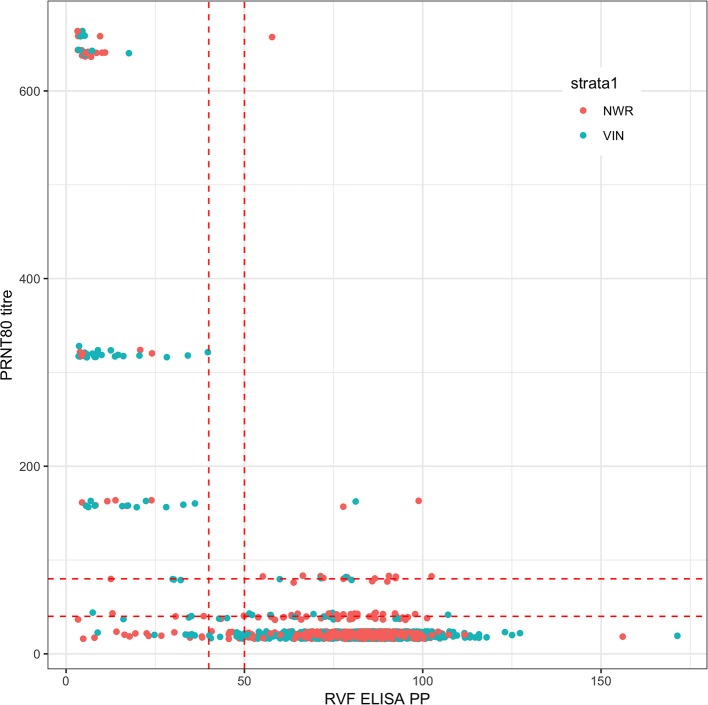
Figure 1.
Bivariate plot of the raw continuous values from the PRNT80 and ID.Vet RVF tests. The points are colored by study site and jittered on the y axis. Horizontal and vertical lines in dashed red were added to mark the various cut-off values used. Note that for the PRNT80 a positive result is greater than the cut-off while for the ID.Vet ELISA is lower than the cut-off.

