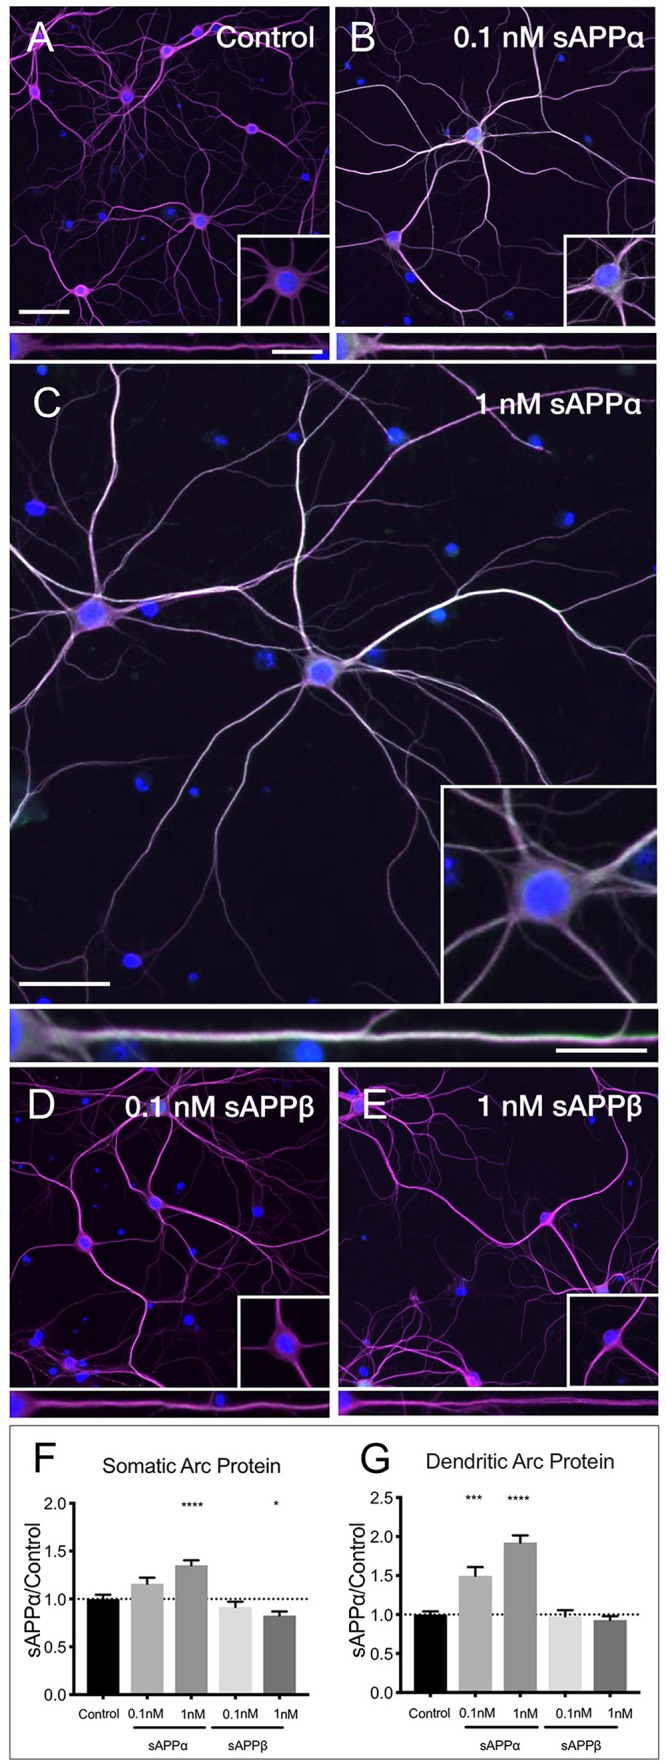
FIGURE 4.

sAPPα promotes Arc protein expression in a concentration- dependent manner. Representative images showing Arc protein levels in (A) no drug control, (B) 0.1 nM sAPPα, (C) 1 nM sAPPα, (D) 0.1 nM sAPPβ and (E) 1 nM sAPPβ-treated primary hippocampal neurons. (F) Average data showing 1 nM sAPPα promotes an increase, and 1 nM sAPPβ a modest decrease in Arc protein expression in the somata. (G) Average data showing 0.1 and 1 nM sAPPα promotes an increase in dendritic Arc protein. Data are expressed as mean ± SEM from ≥4 experiments. 0.1 nM: n = 40 cells; 1 nM: n = 80 cells. Significance was calculated using a Kruskal–Wallis one-way ANOVA with Dunn’s multiple comparisons test. ∗p = 0.0378, ∗∗∗p = 0.0002, ∗∗∗∗p ≤ 0.0001. Representative images show neuronal somata and dendritic projections (MAP2; magenta), Arc protein (green), nuclei (DAPI; blue), (scale bar = 50 μm), and magnified somatic (inset, bottom right) and dendritic (100 μm; lower panels; scale bar = 10 μm) compartments.
