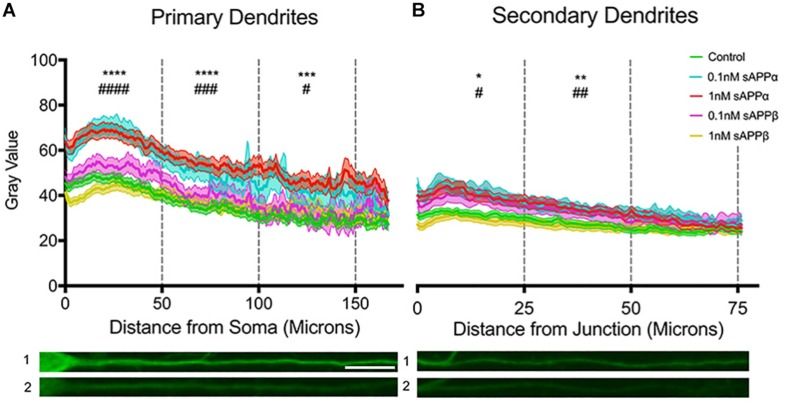
FIGURE 5.
Arc protein expression increases throughout primary and secondary dendrites. Average fluorescent intensity of Arc expression throughout (A) primary and (B) secondary dendrites (mean ± SEM, n = 40–141). Significance was determined by averaging dendritic gray value within each cell and is expressed per treatment group within (A) 50 and (B) 25 microns. Asterisks (∗) and hashes (#) indicate significance found between 1 and 0.1 nM sAPPα, respectively, relative to controls. Representative fluorescence images illustrate Arc protein expression (green) within primary (A1,2) and secondary (B1,2) dendrites in the presence of 1 nM sAPPα (A1,B1) or no drug (A2,B2). Significance was determined by Kruskal–Wallis One-Way ANOVA and Dunn’s multiple comparisons test. ∗/#p = ≤ 0.05 ∗∗/##p = ≤ 0.005, ∗∗∗/###p = 0.0005, ∗∗∗∗/####p = ≤ 0.0001. Scale bar = 50 μm.

