FIGURE 9.
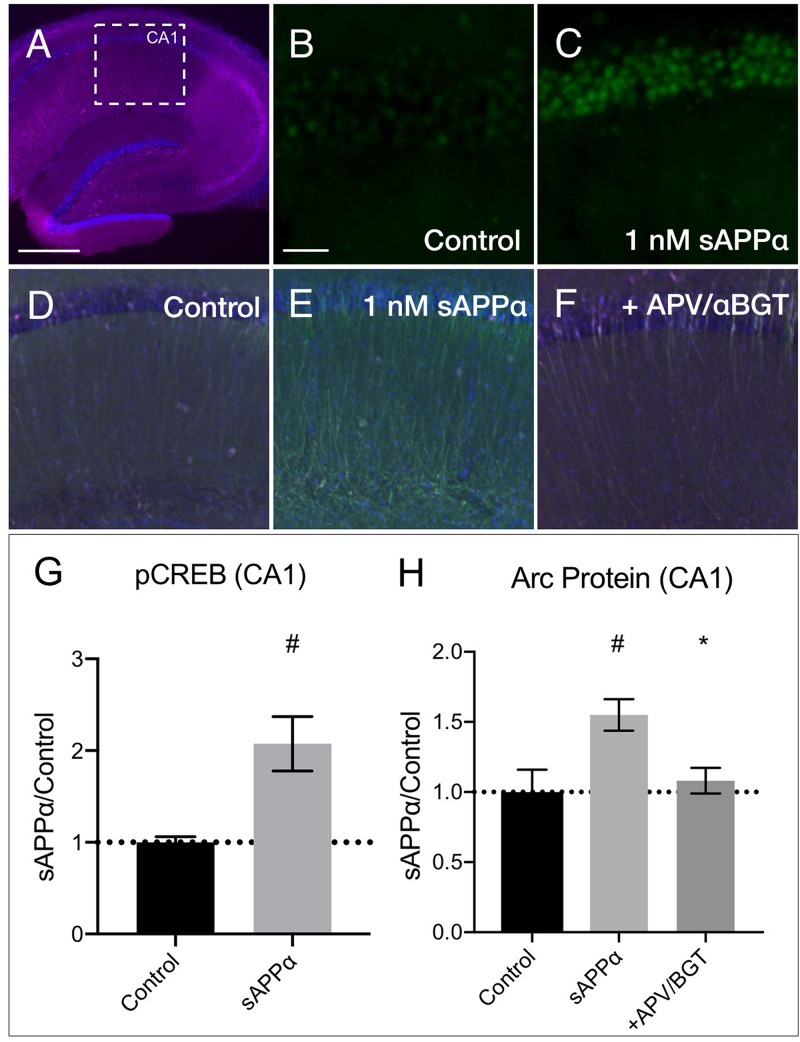
sAPPα increases in CREB phosphorylation and Arc protein in acute hippocampal slices. (A) A representative transverse section of an acute hippocampal slice, with a subregion of area CA1, used for quantitative analysis, outlined by a white dotted box (neurons: MAP2/magenta; nuclei: DAPI/blue; imaged at 4x magnification; scale bar = (500 μm). Relative to (B) no drug controls, (C) incubation of slices with sAPPα (1 nM, 15 min, n = 2 rats, 4 slices) increased pCREBser133 (green; imaged at 20x magnification; scale bar = 100 μm) in the PCL of CA1. Relative to (D) no drug controls, (E) incubation of slices with sAPPα (1 nM, 2 h, n = 3 rats, 4 slices) significantly increased Arc protein expression (green; imaged at 4x magnification) in area CA1. Co-incubation of sAPPα with (F) APV and αBGT (n = 3 rats, 4 slices) attenuated this effect. Normality was detected by Shapiro–Wilk normality tests. Data are expressed as mean ± SEM. Significance of pCREB (G) and (H) Arc protein expression was calculated using a students t-test, and one-way ANOVA with Šidák’s multiple comparisons test, respectively. Hashes (#) indicate significance between control and sAPPα-treated; asterisks (∗) indicate significance between sAPPα- and antagonist-treated; #p ≤ 0.05, ∗p = 0.04. CA1, cornu ammonis 1; PCL, pyramidal cell layer.

