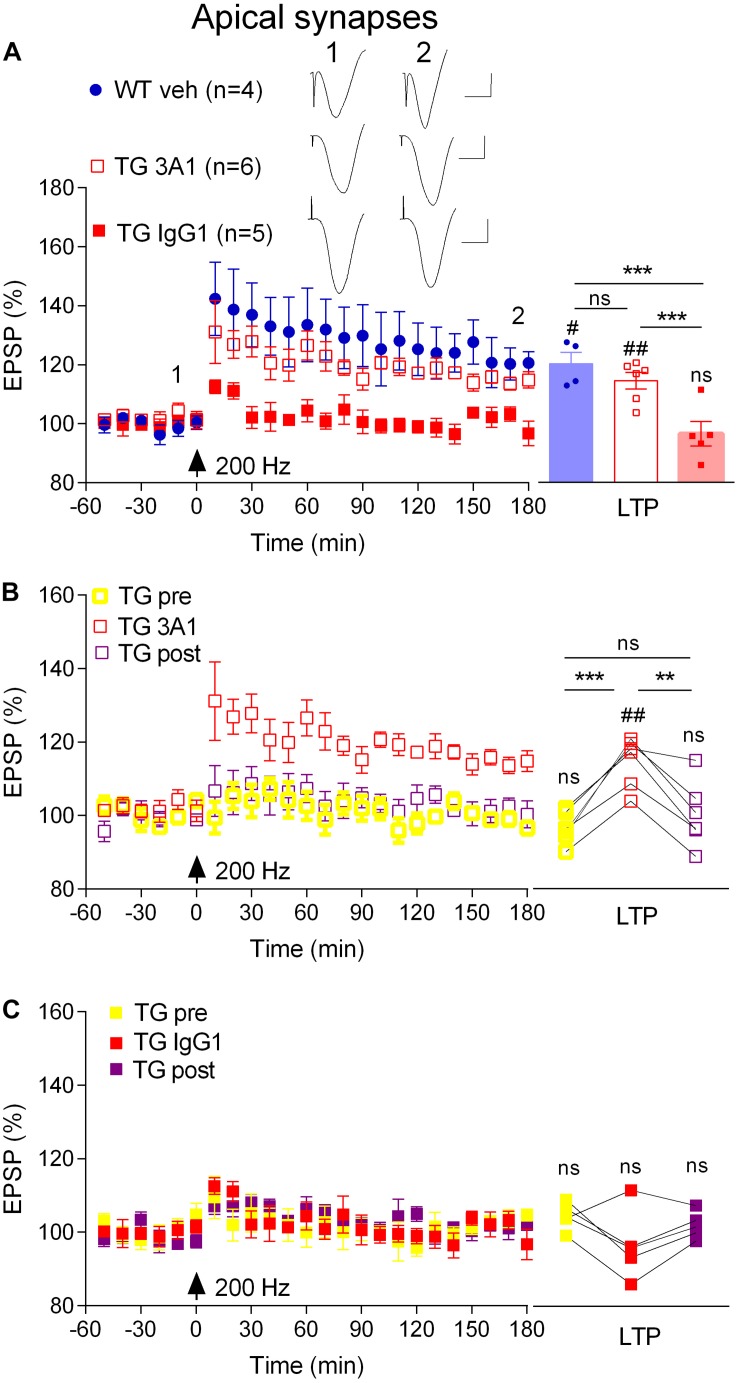
FIGURE 2.
An aggregate conformation-selective anti-Aß antibody, 3A1, transiently rescues the LTP deficit in freely behaving transgenic rats. (A) In a cross-sectional analysis, repeated i.c.v. treatment of 4–6-month-old TG rats with 3A1 (TG 3A1) but not isotype control antibody IgG1 (TG IgG1) restored LTP to a level indistinguishable from WT littermates injected with vehicle (WT veh). Left hand panel shows LTP time course. Inserts show representative EPSP traces at the times indicated. Calibration bars: vertical, 1 mV; horizontal, 10 ms. Summary bar chart of LTP (last 10 min post-HFS) is in the right-hand panel. (B,C) A longitudinal analysis revealed the transient nature of the recovery of LTP in TG animals injected with 3A1. The LTP time course from the same TG animals the week before (TG pre), immediately after (TG 3A1 or TG IgG1), and 1 week after (TG post) treatment is shown in the left panels. Right hand panels show longitudinal data from individual rats. Arrows indicate the time point of application of a single set of 200 Hz HFS at test pulse intensity (200 Hz). The # symbol stands for a statistical comparison between pre- and 3 h post-HFS values within one group (paired t-test) whereas an * indicates a comparison of 3 h post-HFS values between groups (one-way ANOVA (A) or one-way ANOVA with repeated measures (B,C) followed by post hoc Bonferroni test). One symbol, p < 0.05; two symbols, p < 0.01; three symbols, p < 0.001; ns, p > 0.05. Values are mean ± S.E.M.% pre-HFS baseline EPSP amplitude.

