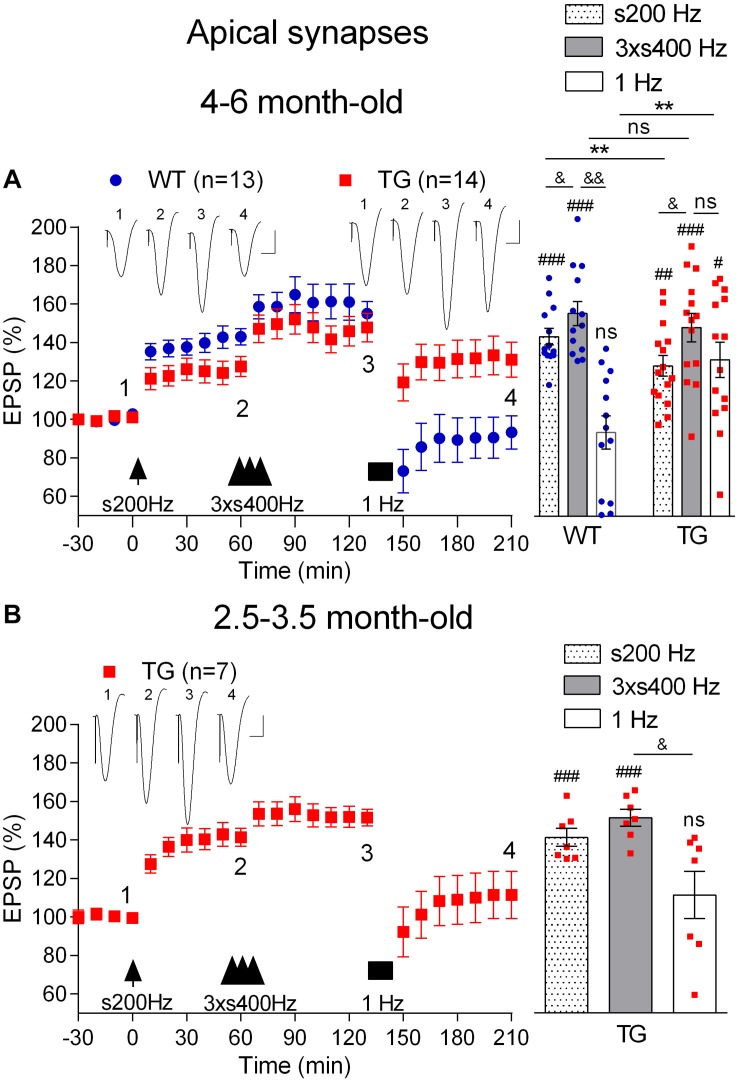
FIGURE 6.
Age-dependent deficit in depotentiation in anaesthetized TG rats. (A) Application of 1 Hz LFS (solid bar) following LTP induction by a sequence of s200 Hz HFS (arrow) and 3 × s400 Hz HFS (three arrow heads) failed to induce persistent depotentiation in 4–6-month-old TG rats, unlike their WT littermates, under urethane anaesthesia. In contrast application of the same 1 Hz LFS protocol completely reversed LTP induced by 3 × s400 Hz HFS in younger (2.5–3.5-month-old) TG animals (B). Left hand panels show LTP time course. Inserts show representative EPSP traces at the times indicated. Calibration bars: vertical, 1 mV; horizontal, 10 ms. Summary bar charts of potentiation at the same three time points (s200 Hz, last 10 min post-s200 Hz HFS; 3 × s400 Hz, last 10 min post-3 × s400 Hz HFS; 1 Hz, last 10 min post-1 Hz LFS) are in the right-hand panels. The # symbol stands for a statistical comparison with pre-HFS values within one group and the & symbol stands for a statistical comparison with pre-LFS values within one group (one-way ANOVA with repeated measures followed by post hoc Bonferroni test). An * indicates a comparison of potentiation values between groups (one-way ANOVA with post hoc Bonferroni test). One symbol, p < 0.05; two symbols, p < 0.01; three symbols, p < 0.001; ns, p > 0.05. Values are mean ± S.E.M.% pre-HFS baseline EPSP amplitude.

