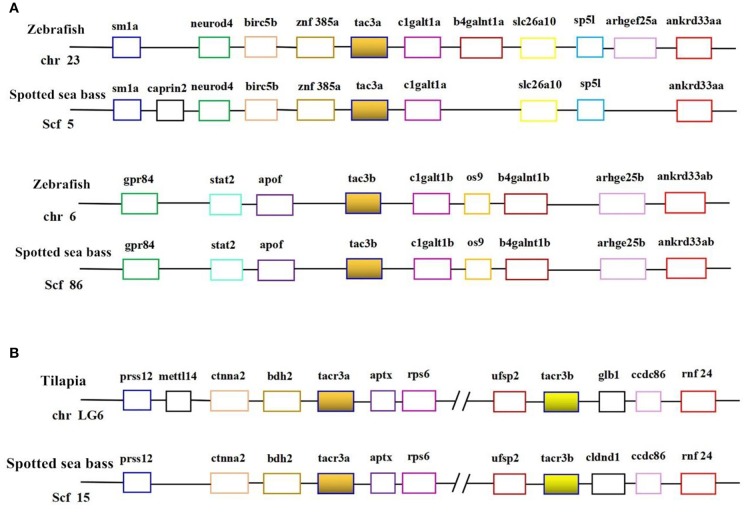
Figure 1.
Syntenic analysis of tac3s (A) in zebrafish and spotted sea bass and tacr3s (B) in tilapia and spotted sea bass. In this map, the spotted sea bass genes are immediately proximal to each other on the chromosome, and the zebrafish tac3s genes and tilapia tacr3s genes are located in the same chromosomal region.

