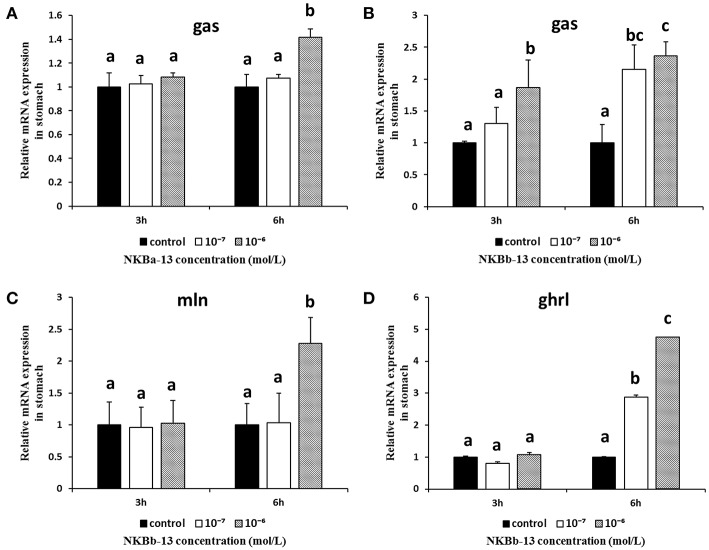
Figure 12.
Effect of NKBs on the expression of brain-gut peptide (BGP)-related genes in the stomach. The X axis indicates hours after NKB treatment. (A,B) Effect of NKBa-13 and NKBb-13 on the mRNA levels of gas in the stomach; (C,D) Effect of NKBb-13 on the mRNA levels of gas and ghrl in the stomach; the results are represented as the mean ± SEM and expressed as fold of the expression level in controls. Significant differences are noted by different letters for each concentration (P < 0.05).

