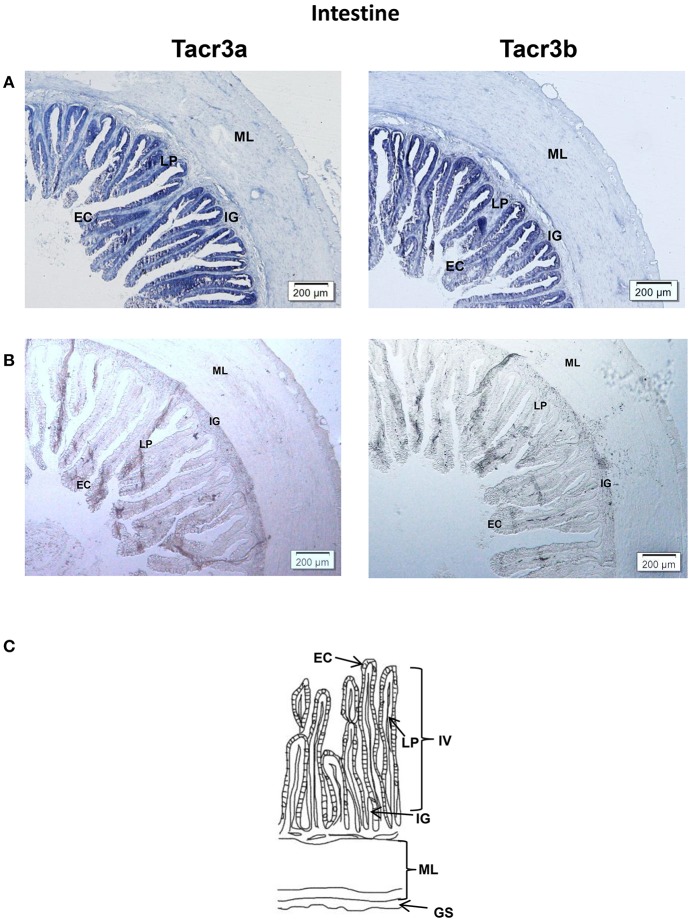
Figure 9.
Photomicrographs and schematic illustrations of the mRNA levels of tacr3s in the intestine of the spotted sea bass, as detected by in situ hybridization (ISH). Positive signal of tacr3a and tacr3b in the intestine (A). Photomicrographs of tacr3a and tacr3b sense probe results in the intestine (B). Schematic diagram for intestine histology (C). GS, gastric serosa; ML, muscular layer; IG, intestinal gland; IV, intestinal villus; LP, lamina propria; EC, epithelial cell.

