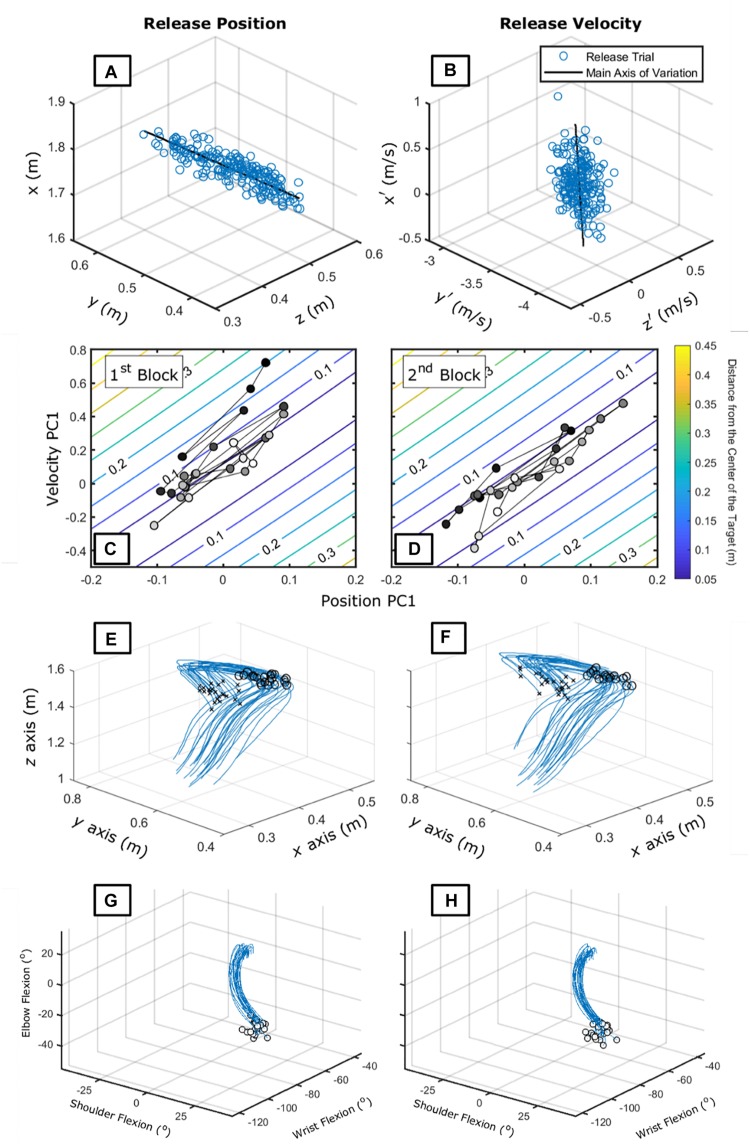
FIGURE 6.
Panels (A,B) show the release parameters [position – (A) and velocity – (B)] of 210 trials of an exemplary participant in his 5th day of practice from Pacheco and Newell (2018c). The black line shows the main axis of variation. Panels (C,D) show the task-space plotted in terms of the first principal component of both velocity and position data for the first (C) and second (D) block of 25 trials. Darker circles represent earlier trials while lighter circles represent later trials. Panels (E,F) show the hand trajectory data for the first (E) and second (F) block of 25 trials. The xs represent the beginning of the recording and the circles represent the release position. Panels (G,H) show the joint motion relation between shoulder, elbow, and wrist for the first (E) and second (G) block of 25 trials. The circles represent the release position. For shoulder, 0 degrees mean the neutral position; for elbow, 180 degrees mean full extension; for wrist, 0 degrees mean neutral position.

