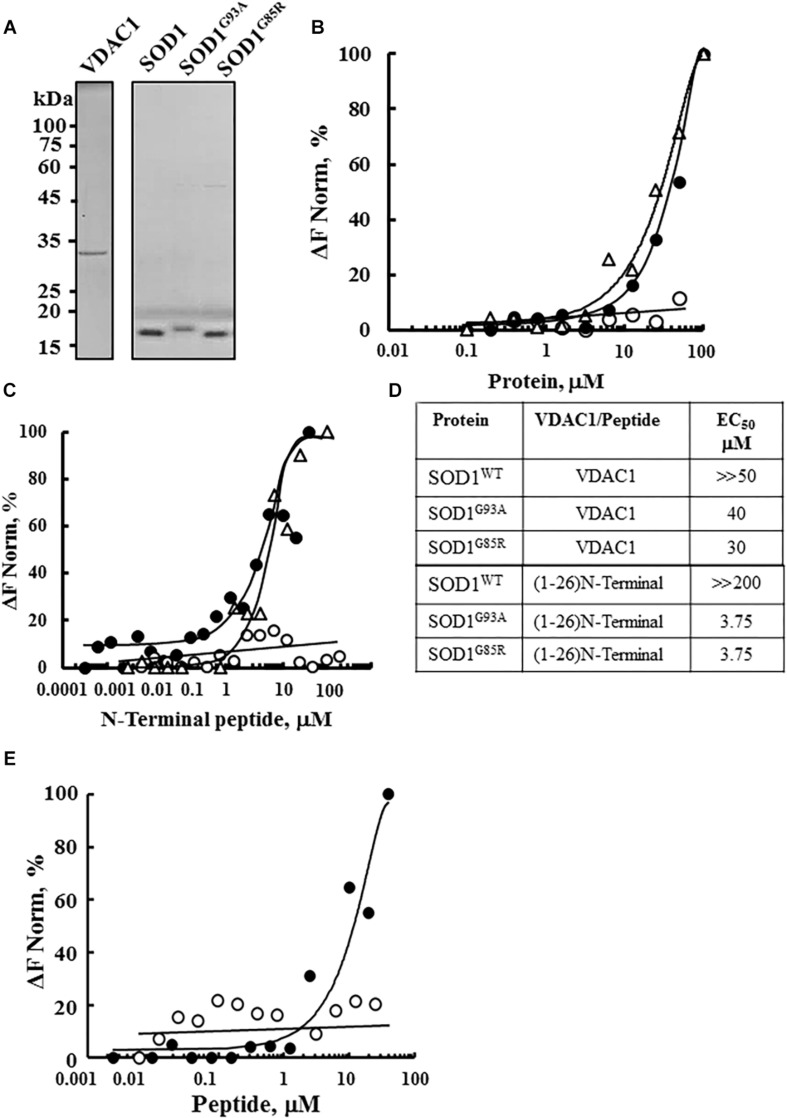
FIGURE 1.
Interaction of wild type and mutant SOD1 with VDAC1 and VDAC1-N-terminal derived peptides. (A) Coomassie blue staining of mitochondrial VDAC1, and recombinant SOD1WT, SOD1G93A, and SOD1G85R expressed in sf-9 cells, purified as described in the Methods section. Molecular weight standards are presented. (B) Purified VDAC1 was fluorescently labeled using a NanoTemper blue protein-labeling kit and incubated with SOD1WT (∘), SOD1G93A (∙), or SOD1G85R (Δ; 0.1–100 μM). After 20 min of incubation, 3–5 μl aliquots were loaded into MST-grade glass capillaries (NanoTemper Technologies) and thermophoresis was measured with a NanoTemper Monolith-NT115 system. The percentage change in normalized fluorescence (ΔF Norm %) is plotted as a function of protein concentration. (C) Fluorescently labeled SOD1WT (∘, 165 nM), SOD1G85R (Δ, 230 nM) or SOD1G93A (∙, 56 nM), was incubated with different concentrations of the VDAC1 N-terminal peptide (0.001–50 μM) in 10 mM HEPES buffer, pH 7.4 and analyzed for binding as in (B). (D) Summary of the binding affinity (dissociation constants) of the peptide to SOD1WT, SOD1G93A and SOD1G85R, as derived from a fitted curve of the percentage change in normalized fluorescence (ΔF Norm %) as a function of peptide and purified VDAC1 concentration. (E) Fluorescently labeled SOD1G93A (675 nM) was incubated with the indicated concentrations of N-terminal (∙, 0.01–40 μM) or LP3 (∘, 6–40 μM) peptides in HEPES buffer, and binding was assayed as in (B). KD values were calculated using the mass action equation in the NanoTemper software from duplicate reads of triplicate experiments.

